Computing and AI
Machine Learning
English · 194 pp. PDF
Part 0: Introduction & Mathematical Foundations
1 What is Machine Learning?
1.1 Core Definitions and Philosophy
Definition 1.1 (Machine Learning). Machine Learning is a field of study that gives computers the ability to learn from data without being explicitly programmed. More formally, a program is said to learn from experience \(E\) with respect to some task \(T\) and performance measure \(P\), if its performance on \(T\), as measured by \(P\), improves with experience \(E\).
Intuition 2. Think of teaching a child to recognize cats. Instead of writing down explicit rules (“has whiskers, four legs, pointy ears”), you show them many pictures of cats and non-cats. Over time, they learn the pattern themselves. Machine learning works similarly—we provide data (experience), and the algorithm discovers the patterns.
Example 1.3 (Email Spam Filter).
Task \(T\): Classify emails as spam or not spam
Experience \(E\): A dataset of emails labeled as spam/not spam
Performance \(P\): Accuracy of classification on new emails
The algorithm learns from labeled examples and improves its classification accuracy over time.
1.2 Types of Machine Learning
Machine learning paradigms are categorized by the type of feedback available during training:
1.2.1 Supervised Learning
In supervised learning, we have a dataset \(\mathcal{D} = \{(\boldsymbol{x}_1, y_1), (\boldsymbol{x}_2, y_2), \ldots, (\boldsymbol{x}_n, y_n)\}\) where \(\boldsymbol{x}_i \in \mathbb{R}^d\) are input features and \(y_i\) are labels.
Classification: \(y_i\) is categorical (e.g., spam/not spam, cat/dog/bird)
Regression: \(y_i\) is continuous (e.g., house prices, temperature)
Goal: Learn a function \(f: \mathbb{R}^d \to \mathcal{Y}\) such that \(f(\boldsymbol{x}) \approx y\) for new, unseen examples.
Example 1.4 (Supervised Learning Applications).
Predicting house prices from size, location, number of rooms (regression)
Diagnosing diseases from medical images (classification)
Speech recognition (classification)
1.2.2 Unsupervised Learning
In unsupervised learning, we only have inputs \(\mathcal{D} = \{\boldsymbol{x}_1, \boldsymbol{x}_2, \ldots, \boldsymbol{x}_n\}\) without labels.
Goal: Discover hidden structure or patterns in the data.
Clustering: Group similar examples together
Dimensionality Reduction: Find lower-dimensional representations
Density Estimation: Model the probability distribution of data
Example 1.5 (Unsupervised Learning Applications).
Customer segmentation in marketing
Anomaly detection in network traffic
Topic modeling in document collections
1.2.3 Semi-Supervised Learning
A middle ground where we have a small amount of labeled data and a large amount of unlabeled data. This is common in practice since labeling is expensive.
1.2.4 Reinforcement Learning
An agent learns to make decisions by interacting with an environment, receiving rewards or penalties for actions.
Agent: The learner/decision maker
Environment: What the agent interacts with
Actions: Choices available to the agent
Rewards: Feedback signal (positive or negative)
Example 1.6 (Reinforcement Learning). Teaching a robot to walk: it tries different leg movements (actions), and receives positive reward when it moves forward and negative reward when it falls.
1.3 Machine Learning vs AI vs Statistics
Artificial Intelligence (AI): The broad goal of creating intelligent machines. ML is a subset of AI.
Machine Learning (ML): Algorithms that improve through experience. Focus on prediction and pattern recognition.
Statistics: The science of collecting, analyzing, and interpreting data. ML borrows heavily from statistics but emphasizes prediction over inference.
The line between ML and statistics is blurry. Roughly: statistics asks “What can we infer?” while ML asks “What can we predict?”
1.4 Major Paradigms and Milestones
1950s-60s: Perceptron, early neural networks
1980s: Backpropagation algorithm
1990s: Support Vector Machines, Random Forests
2000s: Deep learning resurgence, big data
2010s: AlexNet (2012), AlphaGo (2016), Transformers (2017)
2020s: Large language models (GPT, BERT), foundation models
2 Mathematical Foundations
2.1 Linear Algebra Refresher
2.1.1 Vectors and Vector Spaces
Definition 2.1 (Vector). A vector \(\boldsymbol{v} \in \mathbb{R}^n\) is an ordered list of \(n\) real numbers: \[\boldsymbol{v} = \begin{bmatrix} v_1 \\ v_2 \\ \vdots \\ v_n \end{bmatrix}\] We denote vectors in bold lowercase (e.g., \(\boldsymbol{x}, \boldsymbol{w}\)).
Geometric Interpretation: A vector represents a point in \(n\)-dimensional space or a direction with magnitude.
Definition 2.2 (Vector Operations). For \(\boldsymbol{u}, \boldsymbol{v} \in \mathbb{R}^n\) and scalar \(\alpha \in \mathbb{R}\):
Addition: \(\boldsymbol{u} + \boldsymbol{v} = [u_1+v_1, u_2+v_2, \ldots, u_n+v_n]^\top\)
Scalar multiplication: \(\alpha \boldsymbol{v} = [\alpha v_1, \alpha v_2, \ldots, \alpha v_n]^\top\)
Dot product: \(\boldsymbol{u} \cdot \boldsymbol{v} = \boldsymbol{u}^\top \boldsymbol{v} = \sum_{i=1}^n u_i v_i\)
Intuition 9. The dot product \(\boldsymbol{u} \cdot \boldsymbol{v}\) measures how much two vectors point in the same direction: \[\boldsymbol{u} \cdot \boldsymbol{v} = \left\lVert\boldsymbol{u}\right\rVert \left\lVert\boldsymbol{v}\right\rVert \cos\theta\] where \(\theta\) is the angle between them. If \(\theta = 90^{\circ}\), then \(\boldsymbol{u} \cdot \boldsymbol{v} = 0\) (orthogonal).
Definition 2.4 (Norm). The Euclidean norm (or \(\ell_2\)-norm) of a vector \(\boldsymbol{v}\) is: \[\left\lVert\boldsymbol{v}\right\rVert_2 = \sqrt{\sum_{i=1}^n v_i^2} = \sqrt{\boldsymbol{v}^\top \boldsymbol{v}}\] Other common norms include \(\ell_1\)-norm: \(\left\lVert\boldsymbol{v}\right\rVert_1 = \sum_{i=1}^n |v_i|\) and \(\ell_\infty\)-norm: \(\left\lVert\boldsymbol{v}\right\rVert_\infty = \max_i |v_i|\).
2.1.2 Matrices
Definition 2.5 (Matrix). A matrix \(\boldsymbol{A} \in \mathbb{R}^{m \times n}\) is a rectangular array with \(m\) rows and \(n\) columns: \[\boldsymbol{A} = \begin{bmatrix} a_{11} & a_{12} & \cdots & a_{1n} \\ a_{21} & a_{22} & \cdots & a_{2n} \\ \vdots & \vdots & \ddots & \vdots \\ a_{m1} & a_{m2} & \cdots & a_{mn} \end{bmatrix}\] We denote matrices in bold uppercase (e.g., \(\boldsymbol{X}, \boldsymbol{W}\)).
Definition 2.6 (Matrix-Vector Multiplication). For \(\boldsymbol{A} \in \mathbb{R}^{m \times n}\) and \(\boldsymbol{x} \in \mathbb{R}^n\): \[\boldsymbol{A}\boldsymbol{x} = \begin{bmatrix} \boldsymbol{a}_1^\top \boldsymbol{x} \\ \boldsymbol{a}_2^\top \boldsymbol{x} \\ \vdots \\ \boldsymbol{a}_m^\top \boldsymbol{x} \end{bmatrix} \in \mathbb{R}^m\] where \(\boldsymbol{a}_i^\top\) is the \(i\)-th row of \(\boldsymbol{A}\).
Key Point: Matrix multiplication \(\boldsymbol{A}\boldsymbol{x}\) is a linear transformation that maps \(\boldsymbol{x}\) to a new vector.
Definition 2.7 (Matrix-Matrix Multiplication). For \(\boldsymbol{A} \in \mathbb{R}^{m \times n}\) and \(\boldsymbol{B} \in \mathbb{R}^{n \times p}\): \[(\boldsymbol{A}\boldsymbol{B})_{ij} = \sum_{k=1}^n a_{ik} b_{kj}\] Result is \(\boldsymbol{C} \in \mathbb{R}^{m \times p}\).
Definition 2.8 (Transpose). The transpose of \(\boldsymbol{A} \in \mathbb{R}^{m \times n}\) is \(\boldsymbol{A}^\top \in \mathbb{R}^{n \times m}\) where \((\boldsymbol{A}^\top)_{ij} = a_{ji}\).
A matrix is symmetric if \(\boldsymbol{A} = \boldsymbol{A}^\top\).
Definition 2.9 (Identity and Inverse). The identity matrix \(\boldsymbol{I}_n \in \mathbb{R}^{n \times n}\) has 1s on the diagonal and 0s elsewhere: \(\boldsymbol{I}_n \boldsymbol{x} = \boldsymbol{x}\) for all \(\boldsymbol{x}\).
The inverse of a square matrix \(\boldsymbol{A}\) (if it exists) is \(\boldsymbol{A}^{-1}\) such that \(\boldsymbol{A}\boldsymbol{A}^{-1} = \boldsymbol{A}^{-1}\boldsymbol{A} = \boldsymbol{I}\).
2.1.3 Eigenvalues and Eigenvectors
Definition 2.10 (Eigenvalue and Eigenvector). For a square matrix \(\boldsymbol{A} \in \mathbb{R}^{n \times n}\), a non-zero vector \(\boldsymbol{v}\) is an eigenvector with eigenvalue \(\lambda\) if: \[\boldsymbol{A}\boldsymbol{v} = \lambda \boldsymbol{v}\] This means \(\boldsymbol{A}\) stretches \(\boldsymbol{v}\) by factor \(\lambda\) without changing its direction.
Intuition 17. Eigenvectors are special directions that are only scaled (not rotated) by the matrix transformation. They reveal the “natural axes” of the transformation.
Definition 2.12 (Eigendecomposition). A symmetric matrix \(\boldsymbol{A} \in \mathbb{R}^{n \times n}\) can be decomposed as: \[\boldsymbol{A} = \boldsymbol{Q}\boldsymbol{\Lambda}\boldsymbol{Q}^\top\] where \(\boldsymbol{Q}\) contains orthonormal eigenvectors as columns, and \(\boldsymbol{\Lambda}\) is diagonal with eigenvalues.
Importance in ML: Eigendecomposition is crucial for PCA, understanding optimization landscapes, and analyzing neural network behavior.
2.2 Probability Theory
2.2.1 Random Variables and Distributions
Definition 2.13 (Random Variable). A random variable \(X\) is a function that maps outcomes of a random experiment to real numbers. It can be:
Discrete: Takes countable values (e.g., dice roll, coin flip)
Continuous: Takes values in an interval (e.g., height, temperature)
Definition 2.14 (Probability Mass Function (PMF)). For discrete \(X\), the PMF is \(P(X = x)\), satisfying: \[P(X = x) \geq 0, \quad \sum_x P(X = x) = 1\]
Definition 2.15 (Probability Density Function (PDF)). For continuous \(X\), the PDF \(p(x)\) satisfies: \[p(x) \geq 0, \quad \int_{-\infty}^\infty p(x)\,dx = 1, \quad P(a \leq X \leq b) = \int_a^b p(x)\,dx\]
Example 2.16 (Important Distributions).
Bernoulli: \(X \in \{0,1\}\), \(P(X=1) = p\). Models binary outcomes (coin flip).
Gaussian (Normal): \(X \sim \mathcal{N}(\mu, \sigma^2)\) with PDF: \[p(x) = \frac{1}{\sqrt{2\pi\sigma^2}} \exp\left(-\frac{(x-\mu)^2}{2\sigma^2}\right)\] Central to ML due to Central Limit Theorem.
Multivariate Gaussian: \(\boldsymbol{X} \sim \mathcal{N}(\boldsymbol{\mu}, \boldsymbol{\Sigma})\) with PDF: \[p(\boldsymbol{x}) = \frac{1}{(2\pi)^{d/2}|\boldsymbol{\Sigma}|^{1/2}} \exp\left(-\frac{1}{2}(\boldsymbol{x}-\boldsymbol{\mu})^\top\boldsymbol{\Sigma}^{-1}(\boldsymbol{x}-\boldsymbol{\mu})\right)\]
2.2.2 Expectation and Variance
Definition 2.17 (Expectation). The expected value (or mean) of \(X\) is: \[\mathbb{E}[X] = \begin{cases} \sum_x x \cdot P(X=x) & \text{discrete} \\ \int_{-\infty}^\infty x \cdot p(x)\,dx & \text{continuous} \end{cases}\] For a function \(g(X)\): \(\mathbb{E}[g(X)] = \sum_x g(x) P(X=x)\) or \(\int g(x) p(x)\,dx\).
Properties:
Linearity: \(\mathbb{E}[aX + bY] = a\mathbb{E}[X] + b\mathbb{E}[Y]\)
For independent \(X, Y\): \(\mathbb{E}[XY] = \mathbb{E}[X]\mathbb{E}[Y]\)
Definition 2.18 (Variance). The variance measures spread around the mean: \[\mathrm{Var}(X) = \mathbb{E}[(X - \mathbb{E}[X])^2] = \mathbb{E}[X^2] - (\mathbb{E}[X])^2\] Standard deviation: \(\sigma = \sqrt{\mathrm{Var}(X)}\).
Definition 2.19 (Covariance). For two random variables: \[\mathrm{Cov}(X, Y) = \mathbb{E}[(X-\mathbb{E}[X])(Y-\mathbb{E}[Y])] = \mathbb{E}[XY] - \mathbb{E}[X]\mathbb{E}[Y]\] If \(\mathrm{Cov}(X,Y) = 0\), then \(X\) and \(Y\) are uncorrelated (not necessarily independent).
2.2.3 Bayes’ Rule
Theorem 2.20 (Bayes’ Rule). For events \(A\) and \(B\) with \(P(B) > 0\): \[P(A|B) = \frac{P(B|A)P(A)}{P(B)}\] In ML notation with data \(\mathcal{D}\) and parameters \(\theta\): \[P(\theta|\mathcal{D}) = \frac{P(\mathcal{D}|\theta)P(\theta)}{P(\mathcal{D})}\] where:
\(P(\theta|\mathcal{D})\) is the posterior (what we want)
\(P(\mathcal{D}|\theta)\) is the likelihood (how well \(\theta\) explains data)
\(P(\theta)\) is the prior (our initial belief)
\(P(\mathcal{D})\) is the evidence (normalization constant)
Bayes’ rule is fundamental to probabilistic machine learning. It tells us how to update our beliefs about model parameters after seeing data: \[\text{Posterior} \propto \text{Likelihood} \times \text{Prior}\]
2.3 Calculus for Machine Learning
2.3.1 Derivatives and Gradients
Definition 2.21 (Derivative). For a function \(f: \mathbb{R}\to \mathbb{R}\), the derivative at \(x\) is: \[f'(x) = \lim_{h \to 0} \frac{f(x+h) - f(x)}{h}\] Geometric interpretation: slope of the tangent line at \(x\).
Definition 2.22 (Partial Derivative). For \(f: \mathbb{R}^n \to \mathbb{R}\), the partial derivative with respect to \(x_i\) is: \[\frac{\partial f}{\partial x_i} = \lim_{h \to 0} \frac{f(x_1, \ldots, x_i+h, \ldots, x_n) - f(x_1, \ldots, x_n)}{h}\] It measures how \(f\) changes when only \(x_i\) varies.
Definition 2.23 (Gradient). The gradient of \(f: \mathbb{R}^n \to \mathbb{R}\) is the vector of partial derivatives: \[\nabla f(\boldsymbol{x}) = \begin{bmatrix} \frac{\partial f}{\partial x_1} \\ \frac{\partial f}{\partial x_2} \\ \vdots \\ \frac{\partial f}{\partial x_n} \end{bmatrix} \in \mathbb{R}^n\]
The gradient \(\nabla f(\boldsymbol{x})\) points in the direction of steepest ascent of \(f\) at \(\boldsymbol{x}\). To minimize \(f\), we move in the direction \(-\nabla f(\boldsymbol{x})\) (gradient descent).
Definition 2.24 (Jacobian Matrix). For \(\boldsymbol{f}: \mathbb{R}^n \to \mathbb{R}^m\), the Jacobian is: \[\boldsymbol{J} = \begin{bmatrix} \frac{\partial f_1}{\partial x_1} & \cdots & \frac{\partial f_1}{\partial x_n} \\ \vdots & \ddots & \vdots \\ \frac{\partial f_m}{\partial x_1} & \cdots & \frac{\partial f_m}{\partial x_n} \end{bmatrix} \in \mathbb{R}^{m \times n}\]
2.3.2 Chain Rule
Theorem 2.25 (Chain Rule - Scalar Case). If \(y = g(u)\) and \(u = f(x)\), then: \[\frac{\mathrm{d}y}{\mathrm{d}x} = \frac{\mathrm{d}y}{\mathrm{d}u} \cdot \frac{\mathrm{d}u}{\mathrm{d}x}\]
Theorem 2.26 (Chain Rule - Multivariable). If \(z = f(\boldsymbol{y})\) and \(\boldsymbol{y} = g(\boldsymbol{x})\), then: \[\frac{\partial z}{\partial x_i} = \sum_j \frac{\partial z}{\partial y_j} \cdot \frac{\partial y_j}{\partial x_i}\] In matrix form: \(\nabla_{\boldsymbol{x}} z = \boldsymbol{J}_g^\top \nabla_{\boldsymbol{y}} z\).
The chain rule is the foundation of backpropagation in neural networks, allowing us to compute gradients efficiently through layers of composition.
2.3.3 Common Derivatives in ML
| Function \(f(x)\) | Derivative \(f'(x)\) |
|---|---|
| \(x^n\) | \(nx^{n-1}\) |
| \(e^x\) | \(e^x\) |
| \(\ln(x)\) | \(1/x\) |
| \(\frac{1}{1+e^{-x}}\) (sigmoid) | \(\sigma(x)(1-\sigma(x))\) |
| \(\max(0, x)\) (ReLU) | \(\begin{cases} 1 & x > 0 \\ 0 & x \leq 0 \end{cases}\) |
Example 2.27 (Gradient of Linear Model). For \(f(\boldsymbol{w}) = \frac{1}{2}\left\lVert\boldsymbol{X}\boldsymbol{w} - \boldsymbol{y}\right\rVert_2^2\): \[\nabla_{\boldsymbol{w}} f = \boldsymbol{X}^\top(\boldsymbol{X}\boldsymbol{w} - \boldsymbol{y})\] This gradient is used in linear regression optimization.
2.4 Optimization Basics
2.4.1 The Optimization Problem
In ML, we typically want to minimize a loss function: \[\boldsymbol{w}^* = \mathop{\mathrm{arg\,min}}_{\boldsymbol{w}} \mathcal{L}(\boldsymbol{w})\] where \(\mathcal{L}(\boldsymbol{w})\) measures prediction error on training data.
Definition 2.28 (Convex Function). A function \(f: \mathbb{R}^n \to \mathbb{R}\) is convex if for all \(\boldsymbol{x}, \boldsymbol{y}\) and \(\lambda \in [0,1]\): \[f(\lambda \boldsymbol{x} + (1-\lambda)\boldsymbol{y}) \leq \lambda f(\boldsymbol{x}) + (1-\lambda)f(\boldsymbol{y})\] Geometric interpretation: line segment between any two points on the graph lies above the graph.
Why convexity matters: Convex functions have no local minima—any local minimum is a global minimum. This guarantees our optimization will find the best solution.
2.4.2 Gradient Descent
Gradient Descent Algorithm
Input: Initial point \(\boldsymbol{w}_0\), learning rate \(\eta > 0\), tolerance \(\epsilon\)
Output: Approximate minimizer \(\boldsymbol{w}^*\)
Initialize \(t = 0\)
repeat
Compute gradient: \(\boldsymbol{g}_t = \nabla \mathcal{L}(\boldsymbol{w}_t)\)
Update: \(\boldsymbol{w}_{t+1} = \boldsymbol{w}_t - \eta \boldsymbol{g}_t\)
\(t = t + 1\)
until \(\left\lVert\boldsymbol{g}_t\right\rVert < \epsilon\)
return \(\boldsymbol{w}_t\)
Intuition 35. Imagine you’re on a mountain and want to reach the valley in fog (can’t see far). At each step, you:
Feel which direction is steepest downhill (compute gradient)
Take a step in that direction (update parameters)
Repeat until you reach (approximately) the bottom
The learning rate \(\eta\) controls step size. Too large: you might overshoot. Too small: slow convergence.
2.4.3 Stochastic Gradient Descent (SGD)
For large datasets with \(n\) examples, computing the full gradient is expensive: \[\nabla \mathcal{L}(\boldsymbol{w}) = \frac{1}{n}\sum_{i=1}^n \nabla \mathcal{L}_i(\boldsymbol{w})\]
Stochastic Gradient Descent (SGD)
At each iteration, randomly sample one example \(i\) and update: \[\boldsymbol{w}_{t+1} = \boldsymbol{w}_t - \eta \nabla \mathcal{L}_i(\boldsymbol{w}_t)\]
Mini-batch SGD: Sample a small batch of \(b\) examples: \[\boldsymbol{w}_{t+1} = \boldsymbol{w}_t - \eta \frac{1}{b}\sum_{i \in \text{batch}} \nabla \mathcal{L}_i(\boldsymbol{w}_t)\]
Advantages of SGD:
Much faster per iteration (especially for large \(n\))
Can escape shallow local minima due to noise
Enables online learning (update as data arrives)
Trade-off: Noisier updates, may need more iterations to converge.
2.4.4 Learning Rate and Convergence
The learning rate \(\eta\) is crucial:
Too large: Divergence or oscillation
Too small: Very slow convergence
Adaptive: Start large, decay over time
Common schedules:
Step decay: \(\eta_t = \eta_0 \cdot \gamma^{\lfloor t/k \rfloor}\)
Exponential: \(\eta_t = \eta_0 e^{-\lambda t}\)
\(1/t\) decay: \(\eta_t = \eta_0 / (1 + \lambda t)\)
Theorem 2.30 (Convergence of Gradient Descent). For a convex, \(L\)-Lipschitz smooth function \(f\) with learning rate \(\eta < 1/L\): \[f(\boldsymbol{w}_t) - f(\boldsymbol{w}^*) \leq \frac{\left\lVert\boldsymbol{w}_0 - \boldsymbol{w}^*\right\rVert_2^2}{2\eta t}\] This shows convergence rate \(O(1/t)\).
Remark 37. In practice, many ML problems are non-convex (e.g., neural networks), so we only find local minima. However, empirically these local minima often work well.
2.4.5 Beyond Basic Gradient Descent
Modern optimizers improve on vanilla gradient descent:
Momentum: Accumulates past gradients to accelerate in consistent directions \[\boldsymbol{v}_{t+1} = \beta \boldsymbol{v}_t + \eta \nabla \mathcal{L}(\boldsymbol{w}_t), \quad \boldsymbol{w}_{t+1} = \boldsymbol{w}_t - \boldsymbol{v}_{t+1}\]
Adam: Adapts learning rate per parameter using first and second moment estimates. Most popular optimizer in deep learning.
RMSProp: Uses moving average of squared gradients to normalize updates
We’ll explore these in detail in Part 4.
2.5 Summary of Part 0
ML Core Idea: Learn patterns from data rather than explicit programming
Learning Types: Supervised (labeled), unsupervised (unlabeled), reinforcement (rewards)
Linear Algebra: Vectors, matrices, eigenvalues—the language of ML
Probability: Random variables, expectations, Bayes’ rule—modeling uncertainty
Calculus: Gradients and chain rule—the engine of learning
Optimization: Gradient descent—how we actually learn from data
Next Steps: With these foundations, we’re ready to dive into specific ML algorithms. Part 1 covers supervised learning methods: regression, classification, and distance-based models.
Exercise 2.32.
Show that for \(\boldsymbol{A} \in \mathbb{R}^{m \times n}\) and \(\boldsymbol{x} \in \mathbb{R}^n\), \(\frac{\partial }{\partial x}(\boldsymbol{A}\boldsymbol{x}) = \boldsymbol{A}^\top\).
Prove that the sigmoid function \(\sigma(x) = 1/(1+e^{-x})\) satisfies \(\sigma'(x) = \sigma(x)(1-\sigma(x))\).
Implement gradient descent to minimize \(f(x) = (x-3)^2 + 5\) starting from \(x_0 = 0\) with learning rate \(\eta = 0.1\). Track the first 5 iterations.
Part 1: Supervised Learning (Classical Models)
3 Regression Models
In regression, we aim to predict a continuous output \(y \in \mathbb{R}\) from input features \(\boldsymbol{x} \in \mathbb{R}^d\).
3.1 Linear Regression
3.1.1 Problem Formulation
Definition 3.1 (Linear Regression Model). We model the relationship between inputs and outputs as: \[y = \boldsymbol{w}^\top \boldsymbol{x} + b + \epsilon\] where \(\boldsymbol{w} \in \mathbb{R}^d\) are weights, \(b \in \mathbb{R}\) is the bias (intercept), and \(\epsilon\) is noise.
For convenience, we absorb the bias into \(\boldsymbol{w}\) by adding a feature \(x_0 = 1\): \[y \approx \hat{y} = \boldsymbol{w}^\top \boldsymbol{x} = \sum_{j=0}^d w_j x_j\]
Intuition 40. Linear regression assumes the output is a weighted sum of inputs. Think of predicting house price: \(\text{price} = w_1 \cdot \text{size} + w_2 \cdot \text{bedrooms} + w_3 \cdot \text{age} + b\). Each feature contributes linearly to the prediction.
3.1.2 Ordinary Least Squares (OLS)
Given training data \(\mathcal{D} = \{(\boldsymbol{x}_i, y_i)\}_{i=1}^n\), we want to find \(\boldsymbol{w}\) that minimizes prediction error.
Definition 3.3 (Mean Squared Error (MSE) Loss). \[\mathcal{L}(\boldsymbol{w}) = \frac{1}{n}\sum_{i=1}^n (y_i - \boldsymbol{w}^\top\boldsymbol{x}_i)^2 = \frac{1}{n}\left\lVert\boldsymbol{X}\boldsymbol{w} - \boldsymbol{y}\right\rVert_2^2\] where \(\boldsymbol{X} \in \mathbb{R}^{n \times d}\) is the design matrix with rows \(\boldsymbol{x}_i^\top\), and \(\boldsymbol{y} \in \mathbb{R}^n\) is the target vector.
Why squared error?
Mathematically convenient (differentiable, convex)
Penalizes large errors more heavily
Corresponds to maximum likelihood under Gaussian noise assumption
Theorem 3.4 (Normal Equation). The optimal weights that minimize MSE are: \[\boldsymbol{w}^* = (\boldsymbol{X}^\top\boldsymbol{X})^{-1}\boldsymbol{X}^\top\boldsymbol{y}\] provided that \(\boldsymbol{X}^\top\boldsymbol{X}\) is invertible.
Sketch. Take the gradient of \(\mathcal{L}(\boldsymbol{w})\) and set to zero: \[\begin{align} \nabla_{\boldsymbol{w}} \mathcal{L}&= \nabla_{\boldsymbol{w}} \frac{1}{n}(\boldsymbol{X}\boldsymbol{w} - \boldsymbol{y})^\top(\boldsymbol{X}\boldsymbol{w} - \boldsymbol{y}) \\ &= \frac{2}{n}\boldsymbol{X}^\top(\boldsymbol{X}\boldsymbol{w} - \boldsymbol{y}) = 0 \end{align}\] Solving: \(\boldsymbol{X}^\top\boldsymbol{X}\boldsymbol{w} = \boldsymbol{X}^\top\boldsymbol{y} \implies \boldsymbol{w}^* = (\boldsymbol{X}^\top\boldsymbol{X})^{-1}\boldsymbol{X}^\top\boldsymbol{y}\). ◻
Computing the Normal Equation
Direct method:
# X: (n, d) matrix, y: (n,) vector
w = np.linalg.solve(X.T @ X, X.T @ y)
# Better than inv() for numerical stabilityComplexity: \(O(nd^2 + d^3)\) - expensive for large \(d\)!
Alternative: Use gradient descent (iterative, scales better)
3.1.3 Gradient Descent for Linear Regression
Gradient Descent for Linear Regression
Input: Data \(\boldsymbol{X}, \boldsymbol{y}\), learning rate \(\eta\), max iterations \(T\)
Initialize: \(\boldsymbol{w}_0\) randomly
For \(t = 0, 1, \ldots, T-1\):
Compute predictions: \(\hat{\boldsymbol{y}} = \boldsymbol{X}\boldsymbol{w}_t\)
Compute gradient: \(\boldsymbol{g}_t = \frac{2}{n}\boldsymbol{X}^\top(\hat{\boldsymbol{y}} - \boldsymbol{y})\)
Update weights: \(\boldsymbol{w}_{t+1} = \boldsymbol{w}_t - \eta \boldsymbol{g}_t\)
Return: \(\boldsymbol{w}_T\)
Example 3.5 (Linear Regression in 1D). Dataset: \(\{(1, 3), (2, 5), (3, 7), (4, 9)\}\)
True relationship: \(y = 2x + 1\)
Using normal equation with \(\boldsymbol{X} = \begin{bmatrix} 1 & 1 \\ 1 & 2 \\ 1 & 3 \\ 1 & 4 \end{bmatrix}\) and \(\boldsymbol{y} = \begin{bmatrix} 3 \\ 5 \\ 7 \\ 9 \end{bmatrix}\):
We recover \(\boldsymbol{w} = \begin{bmatrix} 1 \\ 2 \end{bmatrix}\) (intercept and slope).
3.2 Regularization
Problem: With many features, the model can overfit—memorizing noise instead of learning the true pattern.
Solution: Add a penalty term to discourage complex models.
3.2.1 Ridge Regression
Definition 3.6 (Ridge Loss). \[\mathcal{L}_{\text{ridge}}(\boldsymbol{w}) = \frac{1}{n}\sum_{i=1}^n (y_i - \boldsymbol{w}^\top\boldsymbol{x}_i)^2 + \lambda \left\lVert\boldsymbol{w}\right\rVert_2^2\] where \(\lambda \geq 0\) is the regularization strength.
Intuition 45. Ridge penalizes large weights, preferring simpler models. The \(\ell_2\) penalty \(\left\lVert\boldsymbol{w}\right\rVert_2^2 = \sum_j w_j^2\) shrinks weights toward zero but never exactly to zero.
Theorem 3.8 (Ridge Solution). The optimal Ridge weights are: \[\boldsymbol{w}^*_{\text{ridge}} = (\boldsymbol{X}^\top\boldsymbol{X} + \lambda \boldsymbol{I})^{-1}\boldsymbol{X}^\top\boldsymbol{y}\] Note: \(\boldsymbol{X}^\top\boldsymbol{X} + \lambda \boldsymbol{I}\) is always invertible for \(\lambda > 0\).
Effect of \(\lambda\):
\(\lambda = 0\): Standard OLS (no regularization)
\(\lambda \to \infty\): \(\boldsymbol{w} \to \boldsymbol{0}\) (maximum regularization)
Intermediate \(\lambda\): Balance fit and simplicity
3.2.2 Lasso Regression (L1 Regularization)
Definition 3.9 (Lasso Loss). \[\mathcal{L}_{\text{lasso}}(\boldsymbol{w}) = \frac{1}{n}\sum_{i=1}^n (y_i - \boldsymbol{w}^\top\boldsymbol{x}_i)^2 + \lambda \left\lVert\boldsymbol{w}\right\rVert_1\] where \(\left\lVert\boldsymbol{w}\right\rVert_1 = \sum_j |w_j|\).
Lasso vs Ridge:
Ridge (\(\ell_2\)): Shrinks weights smoothly, keeps all features
Lasso (\(\ell_1\)): Produces sparse solutions—many weights become exactly zero
Why sparsity? The \(\ell_1\) penalty’s sharp corner at zero encourages weights to hit exactly zero, performing automatic feature selection.
When to use:
Lasso: When you believe only a few features are relevant
Ridge: When all features contribute (small weights acceptable)
3.2.3 ElasticNet
Definition 3.10 (ElasticNet Loss). Combines both penalties: \[\mathcal{L}_{\text{elastic}}(\boldsymbol{w}) = \frac{1}{n}\sum_{i=1}^n (y_i - \boldsymbol{w}^\top\boldsymbol{x}_i)^2 + \lambda_1 \left\lVert\boldsymbol{w}\right\rVert_1 + \lambda_2 \left\lVert\boldsymbol{w}\right\rVert_2^2\]
Benefit: Gets sparsity from \(\ell_1\) and grouping effect from \(\ell_2\) (correlated features selected together).
3.3 Polynomial Regression and Basis Expansion
Definition 3.11 (Polynomial Features). To capture non-linear relationships, transform features. For input \(x\), create: \[\boldsymbol{\phi}(x) = [1, x, x^2, x^3, \ldots, x^p]^\top\] Then fit: \(y = \boldsymbol{w}^\top \boldsymbol{\phi}(x)\)
Intuition 50. Polynomial regression is still linear in parameters \(\boldsymbol{w}\), so we can use the same OLS/Ridge/Lasso methods! We just work in a transformed feature space.
Example 3.13 (Quadratic Fit). Original: \(x\). Transform: \(\boldsymbol{\phi}(x) = [1, x, x^2]^\top\).
Model: \(y = w_0 + w_1 x + w_2 x^2\) (parabola).
This captures non-linear patterns while remaining a linear model in \(\boldsymbol{w}\).
Remark 52. Danger: High-degree polynomials can severely overfit! Use regularization (Ridge/Lasso) to control complexity.
Definition 3.15 (General Basis Functions). More generally, use any basis functions \(\{\phi_j(x)\}_{j=1}^m\): \[y = \sum_{j=1}^m w_j \phi_j(x)\] Examples:
Polynomial: \(\phi_j(x) = x^j\)
Fourier: \(\phi_j(x) = \sin(jx), \cos(jx)\)
Gaussian (RBF): \(\phi_j(x) = \exp(-\gamma\left\lVert x - \mu_j\right\rVert^2)\)
3.4 Logistic Regression
Task shift: From regression (continuous \(y\)) to binary classification (\(y \in \{0, 1\}\)).
3.4.1 The Sigmoid Function
Definition 3.16 (Sigmoid (Logistic) Function). \[\sigma(z) = \frac{1}{1 + e^{-z}}\] Properties:
Range: \((0, 1)\) (perfect for probabilities!)
\(\sigma(0) = 0.5\), \(\sigma(z) \to 1\) as \(z \to \infty\), \(\sigma(z) \to 0\) as \(z \to -\infty\)
Derivative: \(\sigma'(z) = \sigma(z)(1 - \sigma(z))\)
Intuition 55. We need to convert a linear combination \(\boldsymbol{w}^\top\boldsymbol{x}\) (range: \(-\infty\) to \(+\infty\)) to a probability (range: 0 to 1). The sigmoid function does exactly this smoothly!
3.4.2 Logistic Regression Model
Definition 3.18 (Logistic Regression). Model the probability of class 1: \[P(y = 1 | \boldsymbol{x}) = \sigma(\boldsymbol{w}^\top\boldsymbol{x}) = \frac{1}{1 + e^{-\boldsymbol{w}^\top\boldsymbol{x}}}\] Predict class 1 if \(P(y=1|\boldsymbol{x}) \geq 0.5\), i.e., if \(\boldsymbol{w}^\top\boldsymbol{x} \geq 0\).
Definition 3.19 (Decision Boundary). The decision boundary is where \(\boldsymbol{w}^\top\boldsymbol{x} = 0\):
\(\boldsymbol{w}^\top\boldsymbol{x} > 0 \implies\) predict class 1
\(\boldsymbol{w}^\top\boldsymbol{x} < 0 \implies\) predict class 0
This is a linear boundary in the original space (a hyperplane).
3.4.3 Cross-Entropy Loss
Definition 3.20 (Binary Cross-Entropy Loss). For binary labels \(y_i \in \{0, 1\}\): \[\mathcal{L}(\boldsymbol{w}) = -\frac{1}{n}\sum_{i=1}^n \left[y_i \log(\hat{p}_i) + (1-y_i)\log(1-\hat{p}_i)\right]\] where \(\hat{p}_i = \sigma(\boldsymbol{w}^\top\boldsymbol{x}_i)\) is the predicted probability.
Intuition 59. Cross-entropy measures how different our predicted probabilities are from the true labels:
If \(y_i = 1\) and \(\hat{p}_i \approx 1\): loss \(\approx 0\) (good)
If \(y_i = 1\) and \(\hat{p}_i \approx 0\): loss \(\to \infty\) (bad)
Theorem 3.22 (Gradient of Cross-Entropy). The gradient for logistic regression is: \[\nabla_{\boldsymbol{w}} \mathcal{L}= \frac{1}{n}\sum_{i=1}^n (\hat{p}_i - y_i)\boldsymbol{x}_i = \frac{1}{n}\boldsymbol{X}^\top(\hat{\boldsymbol{p}} - \boldsymbol{y})\] Remarkably similar to linear regression! But \(\hat{p}_i = \sigma(\boldsymbol{w}^\top\boldsymbol{x}_i)\) is non-linear.
3.4.4 Multi-Class Classification
Approach 1: One-vs-Rest (OvR)
For \(K\) classes, train \(K\) binary classifiers:
Classifier 1: class 1 vs (class 2, 3, ..., K)
Classifier 2: class 2 vs (class 1, 3, ..., K)
... and so on
At test time, predict the class with highest probability.
Definition 3.23 (Softmax Regression (Multinomial Logistic)). For \(K\) classes, model: \[P(y = k | \boldsymbol{x}) = \frac{e^{\boldsymbol{w}_k^\top\boldsymbol{x}}}{\sum_{j=1}^K e^{\boldsymbol{w}_j^\top\boldsymbol{x}}}\] The softmax function generalizes sigmoid to multiple classes.
Softmax Properties:
Outputs sum to 1: \(\sum_{k=1}^K P(y=k|\boldsymbol{x}) = 1\) (valid probability distribution)
Higher \(\boldsymbol{w}_k^\top\boldsymbol{x}\) gives higher probability for class \(k\)
Reduces to sigmoid when \(K=2\)
Definition 3.24 (Categorical Cross-Entropy). Loss for multi-class (with one-hot encoded labels \(\boldsymbol{y}_i \in \{0,1\}^K\)): \[\mathcal{L}(\boldsymbol{W}) = -\frac{1}{n}\sum_{i=1}^n \sum_{k=1}^K y_{ik} \log(P(y=k|\boldsymbol{x}_i))\]
4 Distance-Based Models
4.1 K-Nearest Neighbors (KNN)
Definition 4.1 (KNN Algorithm). To predict the label of a new point \(\boldsymbol{x}\):
Find the \(k\) nearest training examples to \(\boldsymbol{x}\) (by distance)
For classification: Vote—assign the majority class
For regression: Average—assign the mean of their values
Intuition 64. “You are the average of your \(k\) closest friends.” KNN assumes nearby points have similar labels. It’s a non-parametric method—no training phase, just stores the data!
KNN Classification
Input: Training data \(\mathcal{D} = \{(\boldsymbol{x}_i, y_i)\}_{i=1}^n\), test point \(\boldsymbol{x}_{\text{test}}\), \(k\)
Compute distances: \(d_i = \left\lVert\boldsymbol{x}_{\text{test}} - \boldsymbol{x}_i\right\rVert\) for all \(i\)
Sort: Find indices of \(k\) smallest distances
Vote: \(\hat{y} = \text{mode}\{y_i : i \in \text{k-nearest}\}\)
Output: Predicted label \(\hat{y}\)
4.2 Distance Metrics
Definition 4.3 (Common Distance Metrics). For \(\boldsymbol{x}, \boldsymbol{z} \in \mathbb{R}^d\):
Euclidean (\(\ell_2\)): \(d(\boldsymbol{x}, \boldsymbol{z}) = \sqrt{\sum_{j=1}^d (x_j - z_j)^2}\)
Manhattan (\(\ell_1\)): \(d(\boldsymbol{x}, \boldsymbol{z}) = \sum_{j=1}^d |x_j - z_j|\)
Minkowski (\(\ell_p\)): \(d(\boldsymbol{x}, \boldsymbol{z}) = \left(\sum_{j=1}^d |x_j - z_j|^p\right)^{1/p}\)
Mahalanobis: \(d(\boldsymbol{x}, \boldsymbol{z}) = \sqrt{(\boldsymbol{x}-\boldsymbol{z})^\top\boldsymbol{\Sigma}^{-1}(\boldsymbol{x}-\boldsymbol{z})}\)
where \(\boldsymbol{\Sigma}\) is the covariance matrix. Accounts for correlations and scales features.
Example 4.4 (When to Use Different Metrics).
Euclidean: Default choice, works well when features have similar scales
Manhattan: When features have different units or outliers present
Mahalanobis: When features are correlated or have vastly different variances
4.3 Weighted KNN
Definition 4.5 (Distance-Weighted KNN). Instead of equal votes, weight each neighbor by inverse distance: \[w_i = \frac{1}{d(\boldsymbol{x}_{\text{test}}, \boldsymbol{x}_i) + \epsilon}\] Then predict: \(\hat{y} = \mathop{\mathrm{arg\,max}}_c \sum_{i \in \text{k-nearest, class } c} w_i\)
Benefit: Closer neighbors have more influence, which often improves accuracy.
4.4 The Curse of Dimensionality
In high dimensions, all points become approximately equidistant!
Why? Consider unit hypercube \([0,1]^d\):
Volume of sphere inscribed in cube: \(V \propto r^d\)
As \(d \to \infty\), almost all volume is near the corners
Distance between random points \(\approx \sqrt{d/6}\) with small variance
Impact on KNN:
Nearest neighbors aren’t actually “near”
Need exponentially more data as \(d\) increases
Performance degrades in high dimensions
Solutions:
Feature selection/dimensionality reduction (PCA, feature engineering)
Use distance metrics robust to high dimensions (e.g., cosine similarity)
Regularized methods that work better in high \(d\)
4.5 Choosing k
\(k=1\): Very flexible, but sensitive to noise (high variance)
Large \(k\): Smoother, but may miss local patterns (high bias)
Optimal \(k\): Use cross-validation to select
Remark 68. KNN is a lazy learner—no training time, but prediction is slow (must compute distances to all training points). Use KD-trees or ball trees for faster search.
5 Decision Trees and Rule-Based Methods
5.1 Decision Tree Basics
Definition 5.1 (Decision Tree). A tree structure where:
Internal nodes: Tests on features (e.g., \(x_2 < 5\)?)
Branches: Outcomes of tests
Leaf nodes: Predictions (class label or value)
Prediction: Start at root, follow branches based on feature values until reaching a leaf.
Intuition 70. Decision trees mimic human decision-making: “If age < 30 AND income > 50K, then approve loan.” They’re highly interpretable!
5.2 Splitting Criteria
Key question: At each node, which feature and threshold should we split on?
Goal: Create pure subsets (all same class or similar values).
5.2.1 Entropy and Information Gain
Definition 5.3 (Entropy (Classification)). For a set \(S\) with class distribution \(p_1, p_2, \ldots, p_K\): \[H(S) = -\sum_{k=1}^K p_k \log_2(p_k)\] Entropy measures impurity/uncertainty.
\(H = 0\): Perfectly pure (all one class)
\(H = \log_2(K)\): Maximum impurity (uniform distribution)
Definition 5.4 (Information Gain). The reduction in entropy from splitting on feature \(A\): \[\text{IG}(S, A) = H(S) - \sum_{v \in \text{values}(A)} \frac{|S_v|}{|S|} H(S_v)\] where \(S_v\) is the subset of \(S\) where feature \(A\) has value \(v\).
Choose split: \(A^* = \mathop{\mathrm{arg\,max}}_A \text{IG}(S, A)\)
Example 5.5 (Entropy Calculation). Dataset: 9 positive, 5 negative examples. \[H(S) = -\frac{9}{14}\log_2\left(\frac{9}{14}\right) - \frac{5}{14}\log_2\left(\frac{5}{14}\right) \approx 0.940\]
After splitting on feature \(A\):
Branch 1: 6 pos, 1 neg \(\implies H = 0.592\)
Branch 2: 3 pos, 4 neg \(\implies H = 0.985\)
\[\text{IG} = 0.940 - \left(\frac{7}{14} \cdot 0.592 + \frac{7}{14} \cdot 0.985\right) = 0.151\]
5.2.2 Gini Index
Definition 5.6 (Gini Impurity). \[\text{Gini}(S) = 1 - \sum_{k=1}^K p_k^2\] Alternative to entropy, computationally simpler (no logarithms).
Gini = 0: Pure node
Gini = \(1 - 1/K\): Maximum impurity (for \(K\) classes)
Entropy vs Gini: Both work well in practice. Gini is slightly faster; entropy more theoretically motivated.
5.3 Tree Growing Algorithms
ID3 Algorithm (Iterative Dichotomiser 3)
Input: Dataset \(S\), features \(A\)
Base cases:
If all examples in \(S\) have same class: return leaf with that class
If no features left: return leaf with majority class
Recursive case:
Find best feature: \(A^* = \mathop{\mathrm{arg\,max}}_A \text{IG}(S, A)\)
Create node for \(A^*\)
For each value \(v\) of \(A^*\):
Add branch for \(A^* = v\)
Recursively build subtree on subset \(S_v\)
Return: Decision tree
Remark 75 (Tree Algorithms).
ID3: Original, uses information gain, only categorical features
C4.5: Extension of ID3, handles continuous features and missing values
CART (Classification and Regression Trees): Uses Gini index, builds binary trees, works for regression too
5.4 Regression Trees
For regression, use variance reduction instead of information gain:
Definition 5.8 (Variance Reduction). \[\text{VR}(S, A) = \mathrm{Var}(S) - \sum_{v} \frac{|S_v|}{|S|} \mathrm{Var}(S_v)\] where \(\mathrm{Var}(S) = \frac{1}{|S|}\sum_{i \in S}(y_i - \bar{y})^2\).
At leaves, predict the mean: \(\hat{y} = \frac{1}{|S|}\sum_{i \in S} y_i\).
5.5 Pruning
Problem: Trees can grow very deep and overfit the training data.
Solution: Pruning—simplify the tree by removing branches.
Definition 5.9 (Pre-Pruning (Early Stopping)). Stop growing the tree early if:
Maximum depth reached
Node contains fewer than min_samples_split examples
Information gain below threshold
Definition 5.10 (Post-Pruning). Grow full tree, then prune back:
Grow complete tree
For each internal node, evaluate: “Does removing this subtree improve validation performance?”
If yes, replace subtree with leaf (using majority class or mean)
Cost-Complexity Pruning: Balance tree size and error: \[\text{Cost} = \text{Error}(\text{tree}) + \alpha \cdot |\text{leaves}|\] Increase \(\alpha\) to get simpler trees.
5.6 Interpretability vs Performance
Advantages of Decision Trees:
Interpretable: Easy to visualize and explain (“If-then” rules)
Non-parametric: No assumptions about data distribution
Handles mixed data: Both categorical and numerical features
Feature interactions: Automatically captures interactions
Disadvantages:
High variance: Small data changes can drastically alter tree structure
Greedy: Locally optimal splits may not be globally optimal
Bias toward features with more levels: Tend to favor categorical features with many values
Overfitting: Without pruning, can memorize training data
When to use:
When interpretability is crucial (medical diagnosis, loan approval)
As a baseline or for feature engineering
As components in ensemble methods (Random Forests, Boosting)
6 Bias–Variance Tradeoff
6.1 Decomposition of Prediction Error
Consider a regression problem where true relationship is \(y = f(\boldsymbol{x}) + \epsilon\) with \(\mathbb{E}[\epsilon] = 0\) and \(\mathrm{Var}(\epsilon) = \sigma^2\).
Theorem 6.1 (Bias-Variance Decomposition). The expected test error at a point \(\boldsymbol{x}\) is: \[\mathbb{E}[(\hat{f}(\boldsymbol{x}) - y)^2] = \underbrace{(\mathbb{E}[\hat{f}(\boldsymbol{x})] - f(\boldsymbol{x}))^2}_{\text{Bias}^2} + \underbrace{\mathbb{E}[(\hat{f}(\boldsymbol{x}) - \mathbb{E}[\hat{f}(\boldsymbol{x})])^2]}_{\text{Variance}} + \underbrace{\sigma^2}_{\text{Irreducible Error}}\] where expectation is over different training sets.
Sketch. \[\begin{align} \mathbb{E}[(\hat{f}(\boldsymbol{x}) - y)^2] &= \mathbb{E}[(\hat{f}(\boldsymbol{x}) - f(\boldsymbol{x}) + f(\boldsymbol{x}) - y)^2] \\ &= \mathbb{E}[(\hat{f}(\boldsymbol{x}) - f(\boldsymbol{x}))^2] + \mathbb{E}[(f(\boldsymbol{x}) - y)^2] \\ &\quad + 2\mathbb{E}[(\hat{f}(\boldsymbol{x}) - f(\boldsymbol{x}))(f(\boldsymbol{x}) - y)] \end{align}\] The cross term vanishes since \(f(\boldsymbol{x})\) and \(\hat{f}(\boldsymbol{x})\) are independent of \(\epsilon = y - f(\boldsymbol{x})\).
Expanding the first term: \[\begin{align} \mathbb{E}[(\hat{f}(\boldsymbol{x}) - f(\boldsymbol{x}))^2] &= \mathbb{E}[(\hat{f}(\boldsymbol{x}) - \mathbb{E}[\hat{f}] + \mathbb{E}[\hat{f}] - f)^2] \\ &= \underbrace{\mathrm{Var}(\hat{f}(\boldsymbol{x}))}_{\text{Variance}} + \underbrace{(\mathbb{E}[\hat{f}(\boldsymbol{x})] - f(\boldsymbol{x}))^2}_{\text{Bias}^2} \end{align}\] ◻
6.2 Understanding Bias and Variance
Definition 6.2 (Bias). Bias measures how far the average prediction (over many training sets) is from the true value.
High bias = underfitting:
Model is too simple to capture the true pattern
Example: Linear model for non-linear data
Definition 6.3 (Variance). Variance measures how much predictions vary across different training sets.
High variance = overfitting:
Model is too sensitive to training data fluctuations
Example: Very deep decision tree
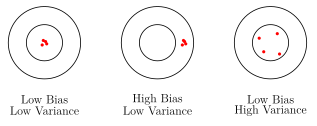
Intuition 82. Think of shooting arrows at a target:
Low bias, low variance: Arrows cluster tightly around bullseye (ideal)
High bias, low variance: Arrows cluster tightly, but away from bullseye (systematic error)
Low bias, high variance: Arrows scattered around bullseye (inconsistent)
High bias, high variance: Arrows scattered far from bullseye (worst case)
6.3 Model Complexity and the Tradeoff
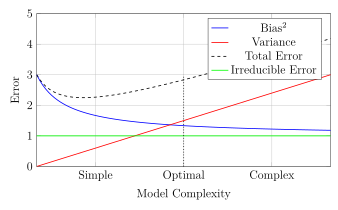
As model complexity increases:
Bias decreases: More flexible models can fit data better
Variance increases: More flexibility means more sensitivity to data
Sweet spot: Balance bias and variance to minimize total error.
6.4 Examples by Model Type
| Model | Bias | Variance |
|---|---|---|
| Linear Regression | High (if data non-linear) | Low |
| High-degree Polynomial | Low | High |
| KNN with \(k=1\) | Low | High |
| KNN with large \(k\) | High | Low |
| Shallow Decision Tree | High | Low |
| Deep Decision Tree | Low | High |
6.5 Controlling the Tradeoff
6.5.1 Cross-Validation
Definition 6.5 (\(k\)-Fold Cross-Validation).
Split data into \(k\) equal folds
For \(i = 1, \ldots, k\):
Train on folds \(\{1, \ldots, k\} \setminus \{i\}\)
Validate on fold \(i\)
Record error \(E_i\)
Report average: \(\text{CV Error} = \frac{1}{k}\sum_{i=1}^k E_i\)
Common choice: \(k = 5\) or \(k = 10\).
Use: Select hyperparameters (e.g., polynomial degree, regularization \(\lambda\), tree depth) by choosing the value with lowest CV error.
Definition 6.6 (Leave-One-Out Cross-Validation (LOOCV)). Special case with \(k = n\) (number of examples). Train on \(n-1\) examples, test on 1. Repeat for each example.
Pros: Maximum training data, nearly unbiased estimate
Cons: Computationally expensive (\(n\) model fits)
6.5.2 Regularization
As discussed earlier, regularization (Ridge, Lasso, ElasticNet) explicitly controls model complexity:
Increases bias (restricts model flexibility)
Decreases variance (less overfitting)
Tune \(\lambda\) via cross-validation to find optimal tradeoff
6.5.3 Ensemble Methods
Preview of Part 3: Combining multiple models can reduce variance without increasing bias:
Bagging (e.g., Random Forests): Reduces variance by averaging
Boosting (e.g., XGBoost): Reduces bias by sequential learning
6.6 Summary of Part 1
Linear Regression: Foundation of supervised learning. Normal equation for closed-form; gradient descent for iterative solution.
Regularization: Ridge (\(\ell_2\)) for shrinkage, Lasso (\(\ell_1\)) for sparsity. Essential for high-dimensional data.
Logistic Regression: Linear model for classification using sigmoid function and cross-entropy loss.
KNN: Non-parametric, instance-based learning. Simple but suffers from curse of dimensionality.
Decision Trees: Interpretable, handles non-linear patterns. Prone to overfitting without pruning.
Bias-Variance Tradeoff: Fundamental tension in ML. Simple models: high bias, low variance. Complex models: low bias, high variance. Use cross-validation and regularization to balance.
Next Steps: Part 2 explores probabilistic models (Naive Bayes, SVMs) that provide uncertainty estimates and maximum-margin classification.
Exercise 6.7.
Derive the gradient of Ridge regression loss and show it leads to \(\boldsymbol{w}^* = (\boldsymbol{X}^\top\boldsymbol{X} + \lambda\boldsymbol{I})^{-1}\boldsymbol{X}^\top\boldsymbol{y}\).
Prove that the sigmoid derivative is \(\sigma'(z) = \sigma(z)(1-\sigma(z))\).
For a dataset with 8 positive and 4 negative examples, compute the entropy. If a feature splits it into (6 pos, 1 neg) and (2 pos, 3 neg), compute the information gain.
Implement KNN (\(k=3\)) on 2D data: \(\{(1,1,+), (2,2,+), (3,1,+), (6,5,-), (7,7,-), (8,6,-)\}\). Classify the point \((4,3)\).
For polynomial regression with degree \(d\), how many parameters are in the model? How does this relate to overfitting as \(d\) increases?
Draw a bias-variance diagram and mark where the following would fall: (a) \(k=1\) KNN, (b) Linear regression on non-linear data, (c) Deep decision tree.
Part 2: Probabilistic Models
7 Naive Bayes
7.1 Probabilistic Classification Framework
Unlike discriminative models (which learn \(P(y|\boldsymbol{x})\) directly), generative models learn the joint distribution \(P(\boldsymbol{x}, y)\) and use Bayes’ rule for prediction.
Definition 7.1 (Bayes’ Rule for Classification). Given features \(\boldsymbol{x}\) and class \(y \in \{1, 2, \ldots, K\}\): \[P(y = c | \boldsymbol{x}) = \frac{P(\boldsymbol{x} | y = c) \cdot P(y = c)}{P(\boldsymbol{x})} = \frac{P(\boldsymbol{x} | y = c) \cdot P(y = c)}{\sum_{k=1}^K P(\boldsymbol{x} | y = k) \cdot P(y = k)}\] where:
\(P(y=c|\boldsymbol{x})\) is the posterior probability (what we want)
\(P(\boldsymbol{x}|y=c)\) is the likelihood (how likely are these features given class \(c\))
\(P(y=c)\) is the prior (how common is class \(c\) in general)
\(P(\boldsymbol{x})\) is the evidence (normalization constant)
Classification rule: \[\hat{y} = \mathop{\mathrm{arg\,max}}_{c} P(y=c|\boldsymbol{x}) = \mathop{\mathrm{arg\,max}}_{c} P(\boldsymbol{x}|y=c) \cdot P(y=c)\] We can ignore \(P(\boldsymbol{x})\) since it doesn’t depend on \(c\).
7.2 The Naive Bayes Assumption
Challenge: For \(d\) features, estimating \(P(\boldsymbol{x}|y=c) = P(x_1, x_2, \ldots, x_d | y=c)\) requires exponentially many parameters.
Solution: Assume conditional independence.
Definition 7.2 (Naive Bayes Assumption). Features are conditionally independent given the class: \[P(\boldsymbol{x} | y = c) = P(x_1, x_2, \ldots, x_d | y = c) = \prod_{j=1}^d P(x_j | y = c)\]
Intuition 88. “Naive” because we assume features don’t interact given the class. For spam detection: knowing an email contains “free” doesn’t change the probability of “money” appearing, given we know it’s spam. This is often false in reality, but works surprisingly well in practice!
Theorem 7.4 (Naive Bayes Classifier). \[\hat{y} = \mathop{\mathrm{arg\,max}}_{c} P(y=c) \prod_{j=1}^d P(x_j | y=c)\] In log space (for numerical stability): \[\hat{y} = \mathop{\mathrm{arg\,max}}_{c} \left[\log P(y=c) + \sum_{j=1}^d \log P(x_j | y=c)\right]\]
7.3 Estimating Parameters
From training data \(\mathcal{D} = \{(\boldsymbol{x}_i, y_i)\}_{i=1}^n\):
Definition 7.5 (Prior Estimation). \[P(y = c) = \frac{\text{count}(y=c)}{n}\] Simply the fraction of training examples in class \(c\).
Definition 7.6 (Likelihood Estimation). Depends on the type of features:
Categorical: \(P(x_j = v | y=c) = \frac{\text{count}(x_j=v, y=c)}{\text{count}(y=c)}\)
Continuous: Assume a distribution (e.g., Gaussian) and estimate parameters
7.4 Variants of Naive Bayes
7.4.1 Gaussian Naive Bayes
For continuous features, assume each feature follows a Gaussian distribution.
Definition 7.7 (Gaussian Naive Bayes). Assume \(P(x_j | y=c) \sim \mathcal{N}(\mu_{jc}, \sigma_{jc}^2)\): \[P(x_j | y=c) = \frac{1}{\sqrt{2\pi\sigma_{jc}^2}} \exp\left(-\frac{(x_j - \mu_{jc})^2}{2\sigma_{jc}^2}\right)\] where \(\mu_{jc}\) and \(\sigma_{jc}^2\) are estimated from training data: \[\mu_{jc} = \frac{1}{n_c}\sum_{i: y_i=c} x_{ij}, \quad \sigma_{jc}^2 = \frac{1}{n_c}\sum_{i: y_i=c} (x_{ij} - \mu_{jc})^2\]
Example 7.8 (Medical Diagnosis). Predict disease (yes/no) from symptoms: temperature and blood pressure.
Training data:
Disease=Yes (3 examples): temps = [38.5, 39.0, 38.7], BP = [140, 145, 142]
Disease=No (2 examples): temps = [36.8, 37.1], BP = [120, 118]
Estimates:
\(P(\text{Disease}=\text{Yes}) = 3/5 = 0.6\)
\(\mu_{\text{temp,yes}} = 38.73\), \(\sigma_{\text{temp,yes}}^2 = 0.043\)
\(\mu_{\text{temp,no}} = 36.95\), \(\sigma_{\text{temp,no}}^2 = 0.0225\)
Similar for blood pressure
Test: Patient with temp=38.0, BP=135. Compute both posteriors and predict the larger.
7.4.2 Multinomial Naive Bayes
For count data (e.g., word frequencies in documents).
Definition 7.9 (Multinomial Naive Bayes). Each feature \(x_j\) is a count of how many times feature \(j\) appears. Model: \[P(\boldsymbol{x} | y=c) = \frac{\left(\sum_j x_j\right)!}{\prod_j x_j!} \prod_{j=1}^d \theta_{jc}^{x_j}\] where \(\theta_{jc} = P(\text{feature } j | y=c)\).
Parameter estimation (with Laplace smoothing): \[\theta_{jc} = \frac{\text{count}(x_j, y=c) + \alpha}{\sum_{j'} \text{count}(x_{j'}, y=c) + \alpha d}\] \(\alpha > 0\) is a smoothing parameter (typically \(\alpha=1\)).
Intuition 95. Laplace smoothing prevents zero probabilities. If a word never appears in spam training data, we still assign it a small non-zero probability rather than zero (which would make the entire product zero).
Example 7.11 (Text Classification). Classify documents as “sports” or “politics”.
Vocabulary: {game, team, vote, election, win}
Training:
Sports docs: “game win”, “team game”, “team win win”
Politics docs: “vote election”, “election win”
Word counts by class:
Sports: game=3, team=2, vote=0, election=0, win=4
Politics: game=0, team=0, vote=1, election=2, win=1
With \(\alpha=1\): \[\theta_{\text{game,sports}} = \frac{3+1}{9+5} = \frac{4}{14} \approx 0.286\]
Test: “game election” \(\to\) compute \(P(\text{sports}|\text{doc})\) and \(P(\text{politics}|\text{doc})\).
7.4.3 Bernoulli Naive Bayes
For binary features (presence/absence).
Definition 7.12 (Bernoulli Naive Bayes). Each \(x_j \in \{0, 1\}\) indicates feature presence: \[P(x_j | y=c) = \theta_{jc}^{x_j}(1-\theta_{jc})^{1-x_j}\] where \(\theta_{jc} = P(x_j=1 | y=c)\).
Estimation: \[\theta_{jc} = \frac{\text{count}(x_j=1, y=c) + \alpha}{\text{count}(y=c) + 2\alpha}\]
Multinomial vs Bernoulli: Multinomial uses counts; Bernoulli uses only presence/absence. For text: Bernoulli asks “Does word \(j\) appear?”; Multinomial asks “How many times?”
7.5 Applications
Spam Filtering:
Features: words in email
Classes: spam / not spam
Use Multinomial or Bernoulli NB
Fast training and prediction
Document Classification:
Categorize news articles, scientific papers
Large vocabularies: naive assumption helps reduce parameters
Sentiment Analysis:
Classify reviews as positive/negative
Features: word frequencies or presence
Advantages:
Simple, fast training and prediction
Works well with small training data
Handles high-dimensional data naturally
Probabilistic predictions (useful for uncertainty estimation)
Limitations:
Strong independence assumption rarely holds
Poor at capturing feature interactions
Probability estimates can be extreme (overconfident)
8 Generative vs Discriminative Models
8.1 Key Distinction
Definition 8.1 (Discriminative Models). Learn the conditional probability \(P(y|\boldsymbol{x})\) directly.
Examples: Logistic regression, SVM, decision trees, neural networks
Goal: Find the decision boundary separating classes
Definition 8.2 (Generative Models). Learn the joint probability \(P(\boldsymbol{x}, y) = P(\boldsymbol{x}|y)P(y)\) and use Bayes’ rule.
Examples: Naive Bayes, Gaussian Discriminant Analysis, HMMs
Goal: Model how data is generated for each class
| Aspect | Generative | Discriminative |
|---|---|---|
| Learns | \(P(\boldsymbol{x}, y)\) | \(P(y|\boldsymbol{x})\) |
| Can sample new data? | Yes | No |
| Outlier detection | Natural | Difficult |
| Performance (large data) | Often worse | Often better |
| Performance (small data) | Often better | Often worse |
| Can handle missing features? | Yes (naturally) | Difficult |
Intuition 100. Generative: “I understand what cats and dogs look like. Let me generate examples of each and see which your image resembles.”
Discriminative: “I just need to distinguish cats from dogs. Let me find the boundary that separates them best.”
Generative models do more (model full distribution), so they need more assumptions. Discriminative models focus only on the decision boundary, often giving better classification.
8.2 Gaussian Discriminant Analysis (GDA)
GDA is a generative classifier that models each class as a multivariate Gaussian.
Definition 8.4 (GDA Model). For binary classification (\(y \in \{0, 1\}\)): \[\begin{align} y &\sim \text{Bernoulli}(\phi) \\ \boldsymbol{x}|y=0 &\sim \mathcal{N}(\boldsymbol{\mu}_0, \boldsymbol{\Sigma}) \\ \boldsymbol{x}|y=1 &\sim \mathcal{N}(\boldsymbol{\mu}_1, \boldsymbol{\Sigma}) \end{align}\] Note: We assume the same covariance \(\boldsymbol{\Sigma}\) for both classes.
Theorem 8.5 (GDA Parameters). Maximum likelihood estimates from data \(\{(\boldsymbol{x}_i, y_i)\}_{i=1}^n\): \[\begin{align} \phi &= \frac{1}{n} \sum_{i=1}^n \mathbb{I}(y_i = 1), \\ \boldsymbol{\mu}_0 &= \frac{\sum_{i=1}^n \mathbb{I}(y_i = 0)\,\boldsymbol{x}_i}{\sum_{i=1}^n \mathbb{I}(y_i = 0)}, \\ \boldsymbol{\mu}_1 &= \frac{\sum_{i=1}^n \mathbb{I}(y_i = 1)\,\boldsymbol{x}_i}{\sum_{i=1}^n \mathbb{I}(y_i = 1)}, \\ \boldsymbol{\Sigma} &= \frac{1}{n} \sum_{i=1}^n \bigl(\boldsymbol{x}_i - \boldsymbol{\mu}_{y_i}\bigr)\bigl(\boldsymbol{x}_i - \boldsymbol{\mu}_{y_i}\bigr)^\top. \end{align}\]
Theorem 8.6 (GDA Decision Boundary). The decision boundary where \(P(y=1|\boldsymbol{x}) = P(y=0|\boldsymbol{x})\) is linear: \[\boldsymbol{w}^\top\boldsymbol{x} + w_0 = 0\] where \(\boldsymbol{w} = \boldsymbol{\Sigma}^{-1}(\boldsymbol{\mu}_1 - \boldsymbol{\mu}_0)\) and \(w_0\) involves \(\phi\), \(\boldsymbol{\mu}_0\), \(\boldsymbol{\mu}_1\).
This shows GDA produces a linear classifier, similar to logistic regression!
GDA vs Logistic Regression:
Both produce linear decision boundaries
GDA makes stronger assumptions (Gaussian distributions)
If assumptions hold, GDA is more efficient (needs less data)
If assumptions violated, logistic regression is more robust
GDA can be viewed as a special case that implies logistic regression
Rule of thumb: Try both. If data looks roughly Gaussian, GDA may work better. Otherwise, prefer logistic regression.
9 Support Vector Machines
9.1 Intuition: Maximum Margin Classification
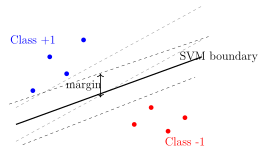
Unlike logistic regression (which finds any separating hyperplane), SVM finds the hyperplane with the largest margin.
Definition 9.1 (Margin). The margin is the distance from the decision boundary to the nearest data point.
A maximum margin classifier maximizes this distance.
Intuition 108. Imagine two classes of points that are linearly separable. Many hyperplanes separate them, but intuitively, the one in the “middle” (farthest from both classes) is most robust to noise and generalizes better.
9.2 Mathematical Formulation (Hard Margin)
Definition 9.3 (Linear Classifier). Decision function: \(f(\boldsymbol{x}) = \boldsymbol{w}^\top\boldsymbol{x} + b\)
Prediction: \(\hat{y} = \text{sign}(f(\boldsymbol{x})) = \begin{cases} +1 & \text{if } f(\boldsymbol{x}) > 0 \\ -1 & \text{if } f(\boldsymbol{x}) < 0 \end{cases}\)
Definition 9.4 (Functional and Geometric Margin). Functional margin of \((\boldsymbol{w}, b)\) with respect to \((\boldsymbol{x}_i, y_i)\): \[\hat{\gamma}_i = y_i(\boldsymbol{w}^\top\boldsymbol{x}_i + b)\] Positive when correctly classified.
Geometric margin (actual distance to hyperplane): \[\gamma_i = \frac{y_i(\boldsymbol{w}^\top\boldsymbol{x}_i + b)}{\left\lVert\boldsymbol{w}\right\rVert}\]
Theorem 9.5 (Hard Margin SVM (Primal Form)). To maximize the margin: \[\begin{aligned} \max_{\boldsymbol{w}, b} \quad & \frac{1}{\left\lVert\boldsymbol{w}\right\rVert} \\ \text{subject to} \quad & y_i(\boldsymbol{w}^\top\boldsymbol{x}_i + b) \geq 1, \quad i = 1, \ldots, n \end{aligned}\] Equivalently (minimization form): \[\begin{aligned} \min_{\boldsymbol{w}, b} \quad & \frac{1}{2}\left\lVert\boldsymbol{w}\right\rVert^2 \\ \text{subject to} \quad & y_i(\boldsymbol{w}^\top\boldsymbol{x}_i + b) \geq 1, \quad i = 1, \ldots, n \end{aligned}\]
Intuition 112. The constraint \(y_i(\boldsymbol{w}^\top\boldsymbol{x}_i + b) \geq 1\) ensures all points are correctly classified and at least distance \(1/\left\lVert\boldsymbol{w}\right\rVert\) from the boundary. Minimizing \(\left\lVert\boldsymbol{w}\right\rVert^2\) maximizes the margin \(1/\left\lVert\boldsymbol{w}\right\rVert\).
9.3 Lagrange Duality and the Dual Form
The primal is a constrained optimization problem. We use Lagrange multipliers.
Definition 9.7 (Lagrangian). \[\mathcal{L}(\boldsymbol{w}, b, \boldsymbol{\alpha}) = \frac{1}{2}\left\lVert\boldsymbol{w}\right\rVert^2 - \sum_{i=1}^n \alpha_i[y_i(\boldsymbol{w}^\top\boldsymbol{x}_i + b) - 1]\] where \(\alpha_i \geq 0\) are Lagrange multipliers.
Theorem 9.8 (KKT Conditions). At the optimum:
\(\nabla_{\boldsymbol{w}} \mathcal{L} = 0 \implies \boldsymbol{w} = \sum_{i=1}^n \alpha_i y_i \boldsymbol{x}_i\)
\(\frac{\partial \mathcal{L}}{\partial b} = 0 \implies \sum_{i=1}^n \alpha_i y_i = 0\)
\(\alpha_i \geq 0\)
\(\alpha_i [y_i(\boldsymbol{w}^\top\boldsymbol{x}_i + b) - 1] = 0\) (complementary slackness)
The complementary slackness condition is crucial:
If \(\alpha_i > 0\), then \(y_i(\boldsymbol{w}^\top\boldsymbol{x}_i + b) = 1\) (point is on the margin)
These points are called support vectors
Only support vectors affect the decision boundary!
Most \(\alpha_i = 0\) \(\to\) sparse solution
Theorem 9.9 (Dual Form). Substituting the KKT conditions into the Lagrangian: \[\begin{aligned} \max_{\boldsymbol{\alpha}} \quad & \sum_{i=1}^n \alpha_i - \frac{1}{2}\sum_{i=1}^n\sum_{j=1}^n \alpha_i\alpha_j y_i y_j \boldsymbol{x}_i^\top\boldsymbol{x}_j \\ \text{subject to} \quad & \alpha_i \geq 0, \quad i = 1, \ldots, n \\ & \sum_{i=1}^n \alpha_i y_i = 0 \end{aligned}\] This is a quadratic programming problem in \(\boldsymbol{\alpha}\).
Why dual is useful:
Only depends on dot products \(\boldsymbol{x}_i^\top\boldsymbol{x}_j\) (enables kernel trick!)
Sparse solution (most \(\alpha_i = 0\))
Once solved, prediction: \(f(\boldsymbol{x}) = \sum_{i=1}^n \alpha_i y_i \boldsymbol{x}_i^\top\boldsymbol{x} + b\)
9.4 The Kernel Trick
Problem: What if data is not linearly separable?
Solution: Map data to higher-dimensional space where it becomes separable!
Definition 9.10 (Feature Map). Let \(\boldsymbol{\phi}: \mathbb{R}^d \to \mathbb{R}^D\) (with \(D \gg d\)) be a feature map.
Transform: \(\boldsymbol{x} \to \boldsymbol{\phi}(\boldsymbol{x})\)
Run SVM in the transformed space: \(f(\boldsymbol{x}) = \boldsymbol{w}^\top\boldsymbol{\phi}(\boldsymbol{x}) + b\)
Example 9.11 (Simple Kernel). For \(\boldsymbol{x} = [x_1, x_2]^\top\), define: \[\boldsymbol{\phi}(\boldsymbol{x}) = [x_1^2, \sqrt{2}x_1x_2, x_2^2, \sqrt{2}x_1, \sqrt{2}x_2, 1]^\top\] This maps 2D to 6D. Data that’s not linearly separable in 2D might be in 6D!
Issue: Computing \(\boldsymbol{\phi}(\boldsymbol{x})\) explicitly for high \(D\) is expensive.
Theorem 9.12 (Kernel Trick). We only need dot products \(\boldsymbol{\phi}(\boldsymbol{x}_i)^\top\boldsymbol{\phi}(\boldsymbol{x}_j)\) in the dual.
Define kernel function: \(K(\boldsymbol{x}_i, \boldsymbol{x}_j) = \boldsymbol{\phi}(\boldsymbol{x}_i)^\top\boldsymbol{\phi}(\boldsymbol{x}_j)\)
If we can compute \(K\) directly without computing \(\boldsymbol{\phi}\) explicitly, we get efficiency!
Definition 9.13 (Common Kernels).
Linear: \(K(\boldsymbol{x}, \boldsymbol{z}) = \boldsymbol{x}^\top\boldsymbol{z}\)
Polynomial: \(K(\boldsymbol{x}, \boldsymbol{z}) = (\boldsymbol{x}^\top\boldsymbol{z} + c)^p\)
Corresponds to all polynomials up to degree \(p\).
RBF (Radial Basis Function / Gaussian): \[K(\boldsymbol{x}, \boldsymbol{z}) = \exp\left(-\gamma\left\lVert\boldsymbol{x} - \boldsymbol{z}\right\rVert^2\right)\] where \(\gamma > 0\) is a bandwidth parameter.
This corresponds to infinite-dimensional feature space!
Sigmoid: \(K(\boldsymbol{x}, \boldsymbol{z}) = \tanh(\alpha \boldsymbol{x}^\top\boldsymbol{z} + c)\)
The kernel trick magic:
The polynomial kernel \((x^\top z + 1)^2\) computes the dot product in a space of all degree-2 polynomials: \[(x^\top z + 1)^2 = (x_1z_1 + x_2z_2 + 1)^2 = x_1^2z_1^2 + 2x_1x_2z_1z_2 + x_2^2z_2^2 + 2x_1z_1 + 2x_2z_2 + 1\] This equals \(\boldsymbol{\phi}(\boldsymbol{x})^\top\boldsymbol{\phi}(\boldsymbol{z})\) with \(\boldsymbol{\phi}(\boldsymbol{x}) = [x_1^2, \sqrt{2}x_1x_2, x_2^2, \sqrt{2}x_1, \sqrt{2}x_2, 1]^\top\).
We computed this in \(O(d)\) time instead of \(O(D)\) where \(D=\binom{d+2}{2}\)!
For RBF kernel: we operate in infinite dimensions without ever computing infinite-dimensional vectors!
Theorem 9.14 (Kernelized Dual). With kernel \(K\): \[\begin{aligned} \max_{\boldsymbol{\alpha}} \quad & \sum_{i=1}^n \alpha_i - \frac{1}{2}\sum_{i=1}^n\sum_{j=1}^n \alpha_i\alpha_j y_i y_j K(\boldsymbol{x}_i, \boldsymbol{x}_j) \\ \text{subject to} \quad & \alpha_i \geq 0, \sum_{i=1}^n \alpha_i y_i = 0 \end{aligned}\] Prediction: \(f(\boldsymbol{x}) = \sum_{i=1}^n \alpha_i y_i K(\boldsymbol{x}_i, \boldsymbol{x}) + b\)
9.5 Soft Margin SVM
Problem: Real data is rarely perfectly separable. Hard margin SVM fails if any point violates the constraint.
Solution: Allow some misclassifications with penalty.
Definition 9.15 (Slack Variables). Introduce \(\xi_i \geq 0\) for each point:
\(\xi_i = 0\): Point correctly classified with margin \(\geq 1\)
\(0 < \xi_i < 1\): Correctly classified but within margin
\(\xi_i \geq 1\): Misclassified
Relaxed constraint: \(y_i(\boldsymbol{w}^\top\boldsymbol{x}_i + b) \geq 1 - \xi_i\)
Theorem 9.16 (Soft Margin SVM). \[\begin{aligned} \min_{\boldsymbol{w}, b, \boldsymbol{\xi}} \quad & \frac{1}{2}\left\lVert\boldsymbol{w}\right\rVert^2 + C\sum_{i=1}^n \xi_i \\ \text{subject to} \quad & y_i(\boldsymbol{w}^\top\boldsymbol{x}_i + b) \geq 1 - \xi_i \\ & \xi_i \geq 0, \quad i = 1, \ldots, n \end{aligned}\] \(C > 0\) is a hyperparameter controlling the trade-off:
Large \(C\): Fewer violations allowed (closer to hard margin, may overfit)
Small \(C\): More violations allowed (more regularization, may underfit)
Intuition 123. Soft margin balances two goals:
Maximize margin (minimize \(\left\lVert\boldsymbol{w}\right\rVert^2\))
Minimize classification errors (minimize \(\sum \xi_i\))
Parameter \(C\) controls this trade-off. Use cross-validation to choose \(C\).
Definition 9.18 (Hinge Loss Formulation). Soft margin SVM can be written as: \[\min_{\boldsymbol{w}, b} \frac{1}{2}\left\lVert\boldsymbol{w}\right\rVert^2 + C\sum_{i=1}^n \max(0, 1 - y_i(\boldsymbol{w}^\top\boldsymbol{x}_i + b))\] where \(\ell_{\text{hinge}}(z) = \max(0, 1-z)\) is the hinge loss.
This connects SVM to other loss functions (logistic loss, squared loss, etc.).
9.6 Support Vector Regression (SVR)
SVM can also be used for regression!
Definition 9.19 (\(\epsilon\)-insensitive Loss). \[\ell_\epsilon(y, \hat{y}) = \begin{cases} 0 & \text{if } |y - \hat{y}| < \epsilon \\ |y - \hat{y}| - \epsilon & \text{otherwise} \end{cases}\] No penalty for predictions within \(\epsilon\) of the true value.
Definition 9.20 (SVR Formulation). \[\begin{aligned} \min_{\boldsymbol{w}, b} \quad & \frac{1}{2}\left\lVert\boldsymbol{w}\right\rVert^2 + C\sum_{i=1}^n (\xi_i + \xi_i^*)\\ \text{subject to} \quad & y_i - (\boldsymbol{w}^\top\boldsymbol{x}_i + b) \leq \epsilon + \xi_i \\ & (\boldsymbol{w}^\top\boldsymbol{x}_i + b) - y_i \leq \epsilon + \xi_i^* \\ & \xi_i, \xi_i^* \geq 0 \end{aligned}\]
Intuition 127. SVR fits a “tube” of width \(2\epsilon\) around the data. Points inside the tube have no penalty. Points outside pay a linear penalty proportional to their distance from the tube.
9.7 Practical Considerations
Choosing SVM Parameters:
Kernel: Start with RBF (most flexible). Try linear if \(d\) is large.
\(C\): Controls regularization. Use grid search + CV.
\(\gamma\) (for RBF): Controls kernel width. Small \(\gamma\) = wide kernel (smooth), large \(\gamma\) = narrow kernel (complex boundary).
Feature Scaling: Critical for SVMs! Since they use distances, features should be normalized (e.g., to \([0,1]\) or standardized to mean 0, std 1).
Complexity:
Training: \(O(n^2 d)\) to \(O(n^3)\) (solving QP)
Prediction: \(O(n_{\text{sv}} d)\) where \(n_{\text{sv}}\) is number of support vectors
When to use SVMs:
Medium-sized datasets (1000s to 100,000s of examples)
High-dimensional data (works well when \(d > n\))
When you need a strong theoretical guarantee (maximum margin)
Non-linear decision boundaries (with kernels)
When NOT to use SVMs:
Very large datasets (\(n > 1\)M) - use linear models or neural networks
When interpretability is critical - use decision trees or linear models
When probabilistic outputs are essential - use logistic regression or Naive Bayes
9.8 Summary of Part 2
Naive Bayes: Generative classifier using Bayes’ rule with conditional independence assumption. Fast, works well for text classification despite “naive” assumption.
Generative vs Discriminative: Generative models (\(P(\boldsymbol{x}, y)\)) model how data is generated; discriminative models (\(P(y|\boldsymbol{x})\)) focus on decision boundaries. Trade-offs in performance, data requirements, and capabilities.
GDA: Assumes Gaussian distributions per class. Produces linear boundaries like logistic regression but with stronger assumptions.
SVM: Maximum margin classifier. Primal form maximizes margin; dual form enables kernel trick. Soft margin allows violations with penalty \(C\).
Kernel Trick: Implicitly maps to high (or infinite) dimensional spaces via kernel functions. RBF kernel most popular for non-linear boundaries.
SVR: Adapts SVM for regression using \(\epsilon\)-insensitive loss. Fits tube around data.
Next Steps: Part 3 explores ensemble methods (Bagging, Boosting, Stacking) that combine multiple models to achieve better performance than any single model.
Exercise 9.22.
Given training data for spam (words: “free”=10, “money”=8) and ham (“free”=2, “money”=1), with priors \(P(\text{spam})=0.4\), compute \(P(\text{spam}|\text{``free money''})\) using Multinomial Naive Bayes with Laplace smoothing (\(\alpha=1\)).
Prove that if we assume Gaussian distributions with same covariance for both classes (GDA), the posterior \(P(y=1|\boldsymbol{x})\) has the form of logistic regression.
For the polynomial kernel \(K(\boldsymbol{x}, \boldsymbol{z}) = (\boldsymbol{x}^\top\boldsymbol{z} + 1)^2\), explicitly write out the feature map \(\boldsymbol{\phi}(\boldsymbol{x})\) for \(\boldsymbol{x} \in \mathbb{R}^2\).
Show that the RBF kernel \(K(\boldsymbol{x}, \boldsymbol{z}) = \exp(-\gamma\left\lVert\boldsymbol{x}-\boldsymbol{z}\right\rVert^2)\) satisfies the property \(K(\boldsymbol{x}, \boldsymbol{x}) = 1\) and \(K(\boldsymbol{x}, \boldsymbol{z}) \to 0\) as \(\left\lVert\boldsymbol{x}-\boldsymbol{z}\right\rVert \to \infty\).
Consider a 1D SVM with data \(\{(1, +1), (2, +1), (4, -1), (5, -1)\}\). Assuming hard margin is feasible, what are the support vectors?
Explain why feature scaling is critical for SVMs but not for decision trees.
Part 3: Ensemble Methods
10 Introduction to Ensemble Learning
Definition 10.1 (Ensemble Learning). An ensemble method combines predictions from multiple base models (called learners or weak learners) to produce a final prediction that is typically more accurate and robust than any individual model.
Intuition 130. “Wisdom of crowds”: Just as a group of people can make better decisions than individuals, combining multiple models can reduce errors. Different models make different mistakes; by aggregating, we can cancel out individual errors.
Why Ensembles Work:
From the bias-variance perspective:
Reduce Variance: Average multiple high-variance models (e.g., deep trees) \(\to\) more stable predictions
Reduce Bias: Sequentially build models that correct errors of previous ones \(\to\) better fit
Improve Robustness: Different models capture different patterns; ensemble is less likely to fail
Three Main Paradigms:
Bagging: Train models independently on bootstrap samples, then average (reduces variance)
Boosting: Train models sequentially, each focusing on previous errors (reduces bias)
Stacking: Train a meta-model to combine base model predictions (learns optimal combination)
11 Bagging (Bootstrap Aggregating)
11.1 Bootstrap Sampling
Definition 11.1 (Bootstrap Sample). Given a dataset \(\mathcal{D}\) of size \(n\), a bootstrap sample \(\mathcal{D}_i\) is created by:
Randomly sample \(n\) examples from \(\mathcal{D}\) with replacement
Some examples appear multiple times, others not at all
On average, about 63.2% of unique examples appear in each bootstrap sample.
Why 63.2%?. Probability that example \(i\) is NOT selected in one draw: \((1 - 1/n)\)
Probability NOT selected in \(n\) draws: \((1 - 1/n)^n\)
As \(n \to \infty\): \((1 - 1/n)^n \to e^{-1} \approx 0.368\)
So probability of being selected: \(1 - 0.368 = 0.632\) or 63.2%. ◻
11.2 Bagging Algorithm
Bagging for Classification/Regression
Input:
Training data \(\mathcal{D} = \{(\boldsymbol{x}_i, y_i)\}_{i=1}^n\)
Base learning algorithm \(\mathcal{A}\)
Number of models \(M\)
Training:
For \(m = 1\) to \(M\):
Create bootstrap sample \(\mathcal{D}_m\) by sampling \(n\) examples from \(\mathcal{D}\) with replacement
Train base learner: \(h_m = \mathcal{A}(\mathcal{D}_m)\)
Prediction for new example \(\boldsymbol{x}\):
Classification: \(\hat{y} = \text{majority\_vote}(h_1(\boldsymbol{x}), h_2(\boldsymbol{x}), \ldots, h_M(\boldsymbol{x}))\)
Regression: \(\hat{y} = \frac{1}{M}\sum_{m=1}^M h_m(\boldsymbol{x})\)
Output: Ensemble predictor \(H(\boldsymbol{x})\)
Theorem 11.2 (Variance Reduction in Bagging). Suppose we have \(M\) independent models, each with variance \(\sigma^2\) and we average their predictions. The variance of the ensemble is: \[\mathrm{Var}(\text{average}) = \frac{\sigma^2}{M}\] If models are correlated with correlation \(\rho\): \[\mathrm{Var}(\text{average}) = \rho\sigma^2 + \frac{1-\rho}{M}\sigma^2\] As \(M \to \infty\), variance approaches \(\rho\sigma^2\).
Bagging reduces variance most when:
Base learners have high variance (e.g., deep decision trees)
Base learners are diverse (low correlation \(\rho\))
This is why bagging works best with unstable algorithms like decision trees, but doesn’t help much with stable algorithms like linear regression.
11.3 Random Forests
Random Forests extend bagging by adding another source of randomness.
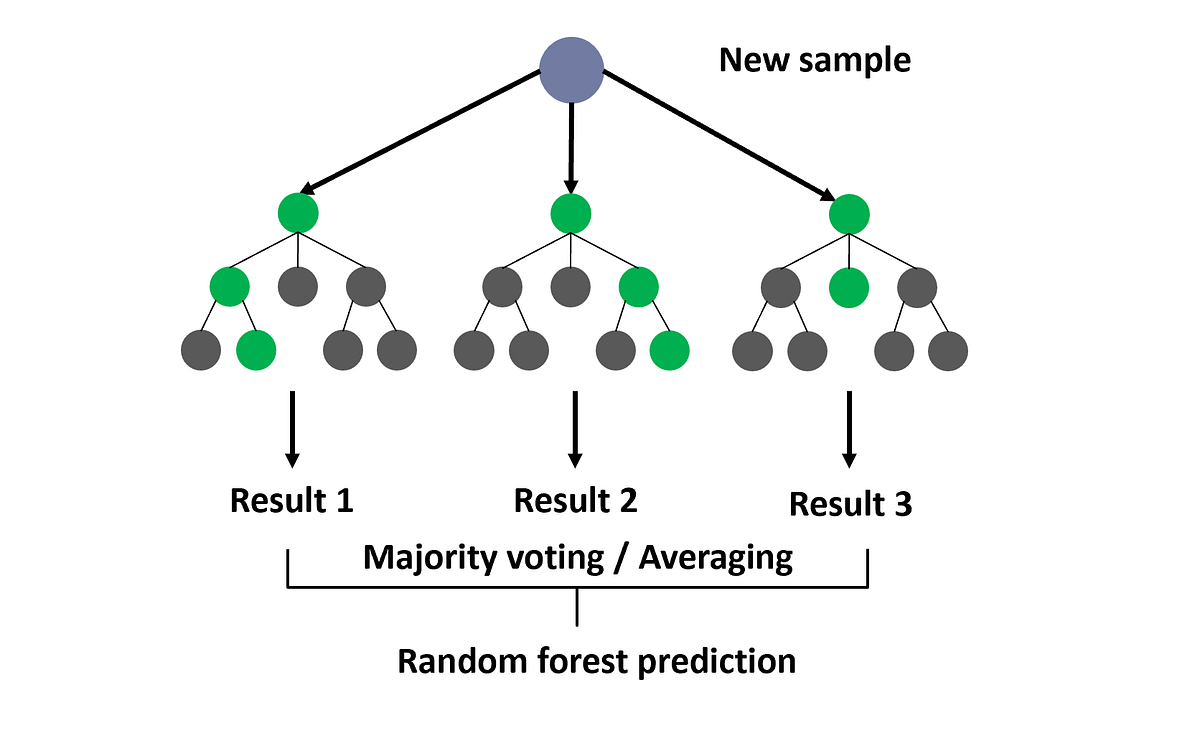
Definition 11.3 (Random Forest). A Random Forest is an ensemble of decision trees where:
Each tree is trained on a bootstrap sample (like bagging)
Additional randomness: At each split, only a random subset of \(m\) features is considered (out of total \(d\) features)
Feature subset size \(m\):
Classification: \(m = \lfloor\sqrt{d}\rfloor\) (default)
Regression: \(m = \lfloor d/3 \rfloor\) (default)
Can tune via cross-validation
Intuition 134. Why limit features at each split?
Without this, trees in bagging would be similar—they’d all split on the strongest features first. By randomly limiting choices, we force trees to consider different features, increasing diversity and decorrelating predictions.
Random Forest Algorithm
Input: Data \(\mathcal{D}\), number of trees \(M\), feature subset size \(m\)
For \(i = 1\) to \(M\):
Draw bootstrap sample \(\mathcal{D}_i\) from \(\mathcal{D}\)
Grow tree \(T_i\) on \(\mathcal{D}_i\):
At each node, randomly select \(m\) features from \(d\) total
Choose best split among these \(m\) features only
Split and recurse until stopping criterion
Do NOT prune trees (grow to maximum depth or min samples)
Prediction: Average (regression) or vote (classification) across all \(M\) trees.
11.4 Out-of-Bag (OOB) Error Estimation
Definition 11.5 (Out-of-Bag (OOB) Examples). For each bootstrap sample, approximately 37% of examples are not selected. These are called out-of-bag (OOB) examples for that tree.
For each data point \((\boldsymbol{x}_i, y_i)\), consider only trees where \(i\) was OOB. Average their predictions to get OOB prediction for \(\boldsymbol{x}_i\).
Definition 11.6 (OOB Error). \[\text{OOB Error} = \frac{1}{n}\sum_{i=1}^n \ell(y_i, \hat{y}_i^{\text{OOB}})\] where \(\hat{y}_i^{\text{OOB}}\) is the prediction using only trees where \(i\) was OOB.
OOB error provides a free validation estimate!
No need for separate validation set
Each example has been tested on \(\approx 37\%\) of trees
Approximates cross-validation error
Can use to tune hyperparameters (number of trees, max depth, etc.)
This is a major practical advantage of Random Forests.
11.5 Feature Importance in Random Forests
Definition 11.7 (Mean Decrease in Impurity (MDI)). For each feature \(j\), compute the total reduction in impurity (Gini or entropy) when splitting on feature \(j\), averaged over all trees and all nodes.
Higher values indicate more important features.
Definition 11.8 (Permutation Importance).
Compute baseline OOB error
For each feature \(j\):
Randomly permute feature \(j\) in OOB data
Compute new OOB error
Importance = increase in error
If permuting a feature greatly increases error, that feature is important.
11.6 Advantages and Limitations
Advantages of Random Forests:
Excellent performance: Often among the best off-the-shelf algorithms
Minimal tuning: Works well with default parameters
Robust to overfitting: Even with many trees
Handles mixed data: Numerical and categorical features
Feature importance: Built-in importance measures
Parallelizable: Trees trained independently
OOB error: Free validation estimate
Limitations:
Less interpretable: Cannot visualize like a single tree
Memory intensive: Must store \(M\) trees
Slow prediction: Must query \(M\) trees
Extrapolation: Cannot predict beyond training range (averaging effect)
Biased toward categorical features: With many levels
Typical hyperparameters:
Number of trees \(M\): 100-1000 (more is usually better, diminishing returns)
Max features \(m\): \(\sqrt{d}\) for classification, \(d/3\) for regression
Min samples per leaf: 1-10 (larger = more regularization)
Max depth: Usually unlimited (full trees)
12 Boosting
12.1 Boosting Philosophy
Unlike bagging (parallel training), boosting trains models sequentially, with each new model focusing on examples that previous models got wrong.
Intuition 139. Think of boosting as learning from mistakes:
Train model 1 on data
Identify examples model 1 struggles with
Train model 2 to focus on those hard examples
Combine models 1 and 2
Repeat, always focusing on current ensemble’s weaknesses
This reduces bias by creating increasingly complex models that fit the data better.
12.2 AdaBoost (Adaptive Boosting)
AdaBoost adjusts weights on training examples, increasing weights on misclassified examples.
AdaBoost for Binary Classification
Input: Data \(\{(\boldsymbol{x}_i, y_i)\}_{i=1}^n\) with \(y_i \in \{-1, +1\}\), number of rounds \(T\)
Initialize: Weights \(w_i^{(1)} = 1/n\) for all \(i\)
For \(t = 1\) to \(T\):
Train weak classifier \(h_t\) on weighted data (minimizing weighted error): \[\epsilon_t = \sum_{i=1}^n w_i^{(t)} \,\mathbb{I}\bigl(h_t(\boldsymbol{x}_i) \neq y_i\bigr)\]
Compute classifier weight: \[\alpha_t = \frac{1}{2}\ln\left(\frac{1-\epsilon_t}{\epsilon_t}\right)\] Higher \(\alpha_t\) for more accurate classifiers.
Update example weights: \[w_i^{(t+1)} = w_i^{(t)} \cdot \exp(-\alpha_t y_i h_t(\boldsymbol{x}_i))\]
If correct (\(y_i = h_t(\boldsymbol{x}_i)\)): weight decreases
If incorrect (\(y_i \neq h_t(\boldsymbol{x}_i)\)): weight increases
Normalize: \(w_i^{(t+1)} = w_i^{(t+1)} / \sum_j w_j^{(t+1)}\)
Final classifier: \[H(\boldsymbol{x}) = \text{sign}\left(\sum_{t=1}^T \alpha_t h_t(\boldsymbol{x})\right)\]
Example 12.2 (AdaBoost Iteration). Suppose after round 1:
Examples 1,2,3 correctly classified
Example 4 misclassified
In round 2:
Example 4 has much higher weight
Next classifier focuses on getting example 4 right
May sacrifice accuracy on 1,2,3 (which already work)
Final ensemble combines both classifiers, each weighted by \(\alpha_t\).
Theorem 12.3 (AdaBoost Training Error Bound). The training error of AdaBoost is bounded by: \[\frac{1}{n}\sum_{i=1}^n \mathbb{I}\bigl(H(\boldsymbol{x}_i) \neq y_i\bigr) \;\leq\; \prod_{t=1}^T 2\sqrt{\epsilon_t(1-\epsilon_t)}\] If each weak learner has error \(\epsilon_t \leq 1/2 - \gamma\) (better than random), then training error decreases exponentially in \(T\).
Weak Learner Assumption: AdaBoost requires weak learners to be better than random guessing (\(\epsilon_t < 0.5\)). Even slightly better than random is enough!
Common weak learners:
Decision stumps: Trees with depth 1 (one split)
Shallow trees: Depth 2-5
Why AdaBoost works:
Reduces both bias (sequential improvement) and variance (averaging)
Focuses on hard examples
Adaptive weights ensure all examples eventually learned
Potential issue: Sensitive to noise and outliers (keeps increasing their weights).
12.3 Gradient Boosting
Gradient Boosting generalizes boosting to arbitrary differentiable loss functions using gradient descent in function space.
Definition 12.4 (Gradient Boosting Framework). Goal: Minimize loss over training data: \[\mathcal{L}= \sum_{i=1}^n \ell(y_i, F(\boldsymbol{x}_i))\] where \(F(\boldsymbol{x})\) is our ensemble model.
Key insight: At iteration \(t\), we have current model \(F_{t-1}\). To improve, we want to move in the direction of steepest descent: \[-\nabla_F \mathcal{L}= -\left[\frac{\partial \ell(y_i, F(\boldsymbol{x}_i))}{\partial F(\boldsymbol{x}_i)}\right]_{F=F_{t-1}}\] These are the negative gradients or pseudo-residuals.
Gradient Boosting Machine (GBM)
Input: Data \(\{(\boldsymbol{x}_i, y_i)\}\), loss \(\ell\), number of iterations \(M\), learning rate \(\eta\)
Initialize: \(F_0(\boldsymbol{x}) = \mathop{\mathrm{arg\,min}}_c \sum_{i=1}^n \ell(y_i, c)\)
For \(m = 1\) to \(M\):
Compute pseudo-residuals: \[r_{im} = -\left[\frac{\partial \ell(y_i, F(\boldsymbol{x}_i))}{\partial F(\boldsymbol{x}_i)}\right]_{F=F_{m-1}}\]
Fit base learner \(h_m\) to pseudo-residuals: \(h_m \approx \{(\boldsymbol{x}_i, r_{im})\}\)
Find optimal step size: \[\rho_m = \mathop{\mathrm{arg\,min}}_\rho \sum_{i=1}^n \ell(y_i, F_{m-1}(\boldsymbol{x}_i) + \rho h_m(\boldsymbol{x}_i))\]
Update model: \[F_m(\boldsymbol{x}) = F_{m-1}(\boldsymbol{x}) + \eta \rho_m h_m(\boldsymbol{x})\] where \(\eta\) is the learning rate (typically 0.01-0.3).
Output: \(F_M(\boldsymbol{x})\)
Example 12.5 (Gradient Boosting for Regression). For squared loss \(\ell(y, F) = \frac{1}{2}(y - F)^2\): \[r_{im} = -\frac{\partial }{\partial F}\left[\frac{1}{2}(y_i - F)^2\right]_{F=F_{m-1}} = y_i - F_{m-1}(\boldsymbol{x}_i)\] The pseudo-residuals are just the ordinary residuals!
So Gradient Boosting for regression fits each new tree to the residuals of the current ensemble.
Gradient Boosting vs AdaBoost:
AdaBoost: Adjusts example weights (specific to exponential loss)
Gradient Boosting: Works with any differentiable loss function
Common loss functions:
Regression: Squared loss, absolute loss, Huber loss
Classification: Logistic loss (log-likelihood)
Ranking: Pairwise ranking loss
Base learners: Typically shallow decision trees (depth 3-8). Deeper trees capture interactions but may overfit.
12.4 XGBoost (Extreme Gradient Boosting)
XGBoost is an optimized implementation of gradient boosting with several enhancements.
Definition 12.6 (XGBoost Objective). At iteration \(t\), minimize: \[\mathcal{L}^{(t)} = \sum_{i=1}^n \ell(y_i, F_{t-1}(\boldsymbol{x}_i) + h_t(\boldsymbol{x}_i)) + \Omega(h_t)\] where \(\Omega(h_t)\) is a regularization term: \[\Omega(h) = \gamma T + \frac{1}{2}\lambda\sum_{j=1}^T w_j^2\] \(T\) = number of leaves, \(w_j\) = leaf weights, \(\gamma\) and \(\lambda\) are regularization parameters.
Key innovations in XGBoost:
Regularization: Explicit control of tree complexity
Second-order approximation: Uses both gradients and Hessians for better optimization
Sparsity awareness: Handles missing values naturally
Column subsampling: Like Random Forest feature randomness
Parallel tree construction: Fast implementation
Cache-aware access patterns: Optimized for modern hardware
Key XGBoost Hyperparameters:
n_estimators: Number of boosting rounds (100-1000)
learning_rate (\(\eta\)): Step size shrinkage (0.01-0.3). Lower \(\to\) more rounds needed but better generalization
max_depth: Tree depth (3-10). Deeper \(\to\) more interactions but overfitting
subsample: Fraction of samples per tree (0.5-1.0). Like bootstrap in bagging
colsample_bytree: Fraction of features per tree (0.5-1.0)
gamma: Minimum loss reduction for split (regularization)
lambda: L2 regularization on weights
alpha: L1 regularization on weights
Tuning strategy:
Fix learning rate (e.g., 0.1), tune tree parameters (max_depth, subsample, colsample)
Tune regularization (gamma, lambda, alpha)
Lower learning rate and increase n_estimators for final model
12.5 LightGBM and CatBoost
Definition 12.7 (LightGBM). Microsoft’s gradient boosting framework with novel algorithms:
Leaf-wise tree growth: Splits leaf with maximum gain (vs level-wise in XGBoost). Faster but can overfit—control with max_depth.
Gradient-based One-Side Sampling (GOSS): Keeps all large-gradient examples, randomly samples small-gradient ones. Reduces data size while maintaining accuracy.
Exclusive Feature Bundling (EFB): Bundles mutually exclusive features (sparse features). Reduces dimensionality.
Advantage: Very fast training, especially on large datasets and high dimensions.
Definition 12.8 (CatBoost). Yandex’s gradient boosting with focus on categorical features:
Ordered boosting: Novel approach to prevent target leakage and prediction shift
Optimal quantization: Better binning of continuous features
Native categorical feature support: No need for manual encoding
Symmetric trees: All trees are balanced (oblivious decision trees)
Advantage: Robust to overfitting, works well out-of-the-box, excellent for categorical data.
| Feature | XGBoost | LightGBM | CatBoost |
|---|---|---|---|
| Speed | Good | Excellent | Good |
| Accuracy | Excellent | Excellent | Excellent |
| Categorical features | Manual encoding | Manual encoding | Native support |
| Tree growth | Level-wise | Leaf-wise | Symmetric |
| Memory usage | Moderate | Low | Moderate |
| Overfitting resistance | Good | Moderate | Excellent |
| Large datasets | Good | Excellent | Good |
12.6 Regularization in Boosting
Boosting is prone to overfitting as we add more trees. Several regularization techniques:
1. Learning Rate (Shrinkage): \[F_m = F_{m-1} + \eta \cdot h_m, \quad 0 < \eta \leq 1\] Smaller \(\eta\) requires more trees but generalizes better. Typical: \(\eta = 0.01\) to \(0.1\).
2. Early Stopping: Monitor validation error. Stop adding trees when validation error stops improving.
3. Subsampling:
Row subsampling: Use random fraction of examples per tree (0.5-1.0)
Column subsampling: Use random fraction of features per tree (0.5-1.0)
Adds randomness like Random Forest, reduces overfitting.
4. Tree Constraints:
Max depth: Limit tree complexity (3-8 typically)
Min samples per leaf: Require minimum examples in leaf nodes
Max number of leaves: Direct control on tree size
5. Explicit Regularization (XGBoost): Add penalty terms for tree complexity (number of leaves, L1/L2 on weights).
Best practice: Combine multiple techniques. Use cross-validation to tune.
12.7 When to Use Boosting vs Bagging
| Criterion | Bagging (Random Forest) | Boosting (XGBoost/GBM) |
|---|---|---|
| Primary goal | Reduce variance | Reduce bias |
| Training | Parallel (fast) | Sequential (slower) |
| Overfitting risk | Low | Moderate to high |
| Tuning required | Minimal | Significant |
| Interpretability | Low | Very low |
| Robustness to noise | High | Moderate (sensitive) |
| Small datasets | Good | Excellent |
| Large datasets | Excellent | Good |
| Out-of-box performance | Very good | Good (needs tuning) |
| Best accuracy (tuned) | Excellent | Excellent |
Rule of thumb:
Start with Random Forest (robust, minimal tuning)
If need last few % accuracy and have time to tune: try XGBoost/LightGBM
If have categorical features: consider CatBoost
If have outliers/noise: prefer Random Forest
For Kaggle competitions: ensemble of both often wins!
13 Stacking and Blending
13.1 Stacking (Stacked Generalization)
Definition 13.1 (Stacking). Train a meta-model (or blender) to combine predictions from multiple base models.
Two levels:
Level 0: Train diverse base models on training data
Level 1: Train meta-model on base model predictions
Stacking with Cross-Validation
Training:
Step 1: Train level-0 models with CV
Split training data into \(K\) folds
For each base model \(m\) and fold \(k\):
Train \(m\) on folds \(\{1, \ldots, K\} \setminus \{k\}\)
Predict on fold \(k\) (out-of-fold predictions)
Concatenate out-of-fold predictions to get \(\hat{\boldsymbol{y}}_m^{\text{OOF}}\) for each model
Retrain each model on full training set for final level-0 models
Step 2: Train level-1 meta-model
Meta-features: \([\hat{\boldsymbol{y}}_1^{\text{OOF}}, \hat{\boldsymbol{y}}_2^{\text{OOF}}, \ldots, \hat{\boldsymbol{y}}_M^{\text{OOF}}]\)
Meta-target: Original labels \(\boldsymbol{y}\)
Train meta-model: \(f_{\text{meta}}(\hat{y}_1, \ldots, \hat{y}_M) \to y\)
Prediction:
Get predictions from all level-0 models
Feed to meta-model for final prediction
Intuition 148. Stacking learns how to optimally combine base models. If model 1 is good at some types of examples and model 2 at others, the meta-model learns when to trust each one.
Why cross-validation? Training base models on full data and then meta-model on training predictions would overfit—base models have seen these examples. CV creates out-of-fold predictions that base models haven’t seen, giving more honest signals to the meta-model.
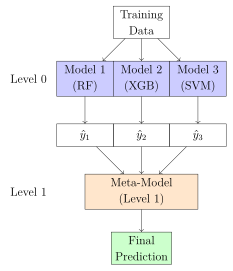
13.2 Blending
Definition 13.3 (Blending). Simplified version of stacking:
Split data: training set + hold-out validation set
Train base models on training set only
Generate predictions on hold-out set
Train meta-model on hold-out predictions
Difference from stacking: Uses single hold-out set instead of cross-validation.
Blending vs Stacking:
Blending: Simpler, faster, but wastes data (hold-out not used for base model training)
Stacking: More complex, uses all data efficiently, more robust
13.3 Choosing Base Models
Diversity is key! Choose base models that make different types of errors.
Good base model combinations:
Different algorithms: Linear models, tree-based, neural networks, SVMs
Different feature sets: Some models with all features, some with subsets
Different hyperparameters: Multiple trees with different depths
Different preprocessing: Some with PCA, some without; different scalings
Poor combination: 5 XGBoost models with similar hyperparameters (too correlated).
Meta-model choices:
Linear/Logistic Regression: Simple, interpretable weights show model contributions
Shallow tree: Can capture interactions between base models
Neural network: Can learn complex combinations
Usually simple meta-models work best—base models already do the heavy lifting.
13.4 Practical Implementation
Stacking in Practice:
from sklearn.ensemble import StackingClassifier
from sklearn.linear_model import LogisticRegression
from sklearn.ensemble import RandomForestClassifier
from xgboost import XGBClassifier
from sklearn.svm import SVC

# Define base models
base_models = [
    ('rf', RandomForestClassifier(n_estimators=100)),
    ('xgb', XGBClassifier(n_estimators=100)),
    ('svm', SVC(probability=True))
]

# Define meta-model
meta_model = LogisticRegression()

# Create stacking ensemble
stacking = StackingClassifier(
    estimators=base_models,
    final_estimator=meta_model,
    cv=5  # 5-fold CV for out-of-fold predictions
)

# Train
stacking.fit(X_train, y_train)

# Predict
y_pred = stacking.predict(X_test)Tips:
Use 5-10 fold CV for stacking
Include original features as inputs to meta-model (optional, often helps)
For competitions: Stack multiple levels (3-4 levels possible)
Ensure no information leakage between levels
Validate on completely separate test set
13.5 Multi-Level Stacking
Definition 13.4 (Multi-Level Stacking). Extend to more than 2 levels:
Level 0: Many diverse base models
Level 1: Mid-level models on level-0 predictions
Level 2: Top-level meta-model on level-1 predictions
... (can continue)
Caution: Diminishing returns after 2-3 levels. More levels increase:
Complexity and computational cost
Risk of overfitting
Difficulty in debugging
Used mainly in competitions where every 0.01% matters.
13.6 Summary of Part 3
Ensemble Learning: Combine multiple models for better performance. Three paradigms: bagging, boosting, stacking.
Bagging/Random Forests: Train models independently on bootstrap samples. Reduces variance. RF adds feature randomness. OOB error provides free validation. Excellent general-purpose algorithm.
AdaBoost: Sequential training with adaptive example weights. Focuses on hard examples. Requires weak learners better than random.
Gradient Boosting: Generalizes boosting to arbitrary losses via functional gradient descent. XGBoost, LightGBM, CatBoost are modern optimized implementations with regularization.
Boosting Regularization: Learning rate, early stopping, subsampling, tree constraints. Essential to prevent overfitting.
Stacking: Train meta-model to combine base model predictions. Use CV to generate out-of-fold predictions. Learns optimal combination weights.
Model Selection: Random Forest for robust baseline. XGBoost/LightGBM for maximum accuracy (with tuning). Stacking to combine diverse models.
Next Steps: Part 4 covers neural networks and deep learning: perceptrons, backpropagation, CNNs, RNNs, Transformers, and modern optimization techniques.
Exercise 13.5.
Show that the probability of a specific example appearing in a bootstrap sample approaches \(1 - e^{-1} \approx 0.632\) as \(n \to \infty\).
For a Random Forest with 100 trees, each with 90% accuracy but only 50% correlated predictions, compute the expected ensemble accuracy if we use majority voting.
In AdaBoost, suppose a weak learner has error rate \(\epsilon_t = 0.4\). Compute its weight \(\alpha_t\). What happens if \(\epsilon_t = 0.5\) (random guessing)?
Explain why Gradient Boosting with squared loss is equivalent to sequentially fitting residuals.
Design a stacking ensemble with 4 base models for a classification task. What would you choose as base models and meta-model? Justify your choices.
Compare computational complexity: training 100 decision trees in Random Forest vs XGBoost. Which is faster and why?
For XGBoost, if learning rate is 0.01, how many trees would you typically need? What if learning rate is 0.3?
Part 4: Neural Networks and Deep Learning
14 The Perceptron
14.1 The Perceptron Model
Definition 14.1 (Perceptron). The perceptron is the simplest neural network unit, proposed by Rosenblatt (1958). For binary classification with \(y \in \{-1, +1\}\): \[\hat{y} = \text{sign}(\boldsymbol{w}^\top\boldsymbol{x} + b) = \text{sign}\left(\sum_{i=1}^d w_i x_i + b\right)\] where \(\boldsymbol{w}\) are weights, \(b\) is bias, and \(\text{sign}(z) = \begin{cases} +1 & z \geq 0 \\ -1 & z < 0 \end{cases}\).
Intuition 153. The perceptron is a linear classifier: it separates data with a hyperplane. Think of it as a simplified neuron that “fires” (+1) when the weighted input exceeds a threshold, and doesn’t fire (-1) otherwise.
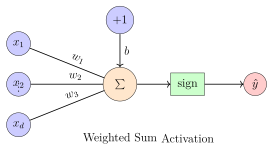
14.2 Perceptron Learning Algorithm
Perceptron Learning Rule
Input: Training data \(\{(\boldsymbol{x}_i, y_i)\}_{i=1}^n\) with \(y_i \in \{-1, +1\}\)
Initialize: \(\boldsymbol{w} = \boldsymbol{0}\), \(b = 0\)
Repeat until convergence (or max iterations):
For each training example \((\boldsymbol{x}_i, y_i)\):
Compute prediction: \(\hat{y}_i = \text{sign}(\boldsymbol{w}^\top\boldsymbol{x}_i + b)\)
If \(\hat{y}_i \neq y_i\) (misclassified): \[\boldsymbol{w} \leftarrow \boldsymbol{w} + y_i\boldsymbol{x}_i, \quad b \leftarrow b + y_i\]
Output: Learned weights \(\boldsymbol{w}\) and bias \(b\)
Intuition 154. The update rule is intuitive:
If true label is \(+1\) but we predicted \(-1\): increase \(\boldsymbol{w}\) in direction of \(\boldsymbol{x}\)
If true label is \(-1\) but we predicted \(+1\): decrease \(\boldsymbol{w}\) in direction of \(\boldsymbol{x}\)
Correct predictions: no update
This gradually rotates the hyperplane to correctly classify examples.
Theorem 14.4 (Perceptron Convergence Theorem). If the training data is linearly separable, the perceptron learning algorithm converges in a finite number of steps. Specifically, if all examples satisfy \(\left\lVert\boldsymbol{x}_i\right\rVert \leq R\) and there exists a unit vector \(\boldsymbol{w}^*\) with margin \(\gamma\) such that \(y_i(\boldsymbol{w}^{*\top}\boldsymbol{x}_i) \geq \gamma\) for all \(i\), then the algorithm makes at most \((R/\gamma)^2\) mistakes.
Sketch. Define mistake counter \(k\). After \(k\) mistakes, the weight vector is a sum of misclassified examples. Using properties of inner products and norms, one can show:
Lower bound: \(\boldsymbol{w}_k \cdot \boldsymbol{w}^* \geq k\gamma\) (progress toward optimal)
Upper bound: \(\left\lVert\boldsymbol{w}_k\right\rVert^2 \leq kR^2\) (bounded growth)
Combining via Cauchy-Schwarz: \(k \leq (R/\gamma)^2\). ◻
14.3 Limitations of the Perceptron
The XOR Problem:
Perceptron can only learn linearly separable functions. The XOR function is not linearly separable:
| \(x_1\) | \(x_2\) | XOR |
|---|---|---|
| 0 | 0 | 0 |
| 0 | 1 | 1 |
| 1 | 0 | 1 |
| 1 | 1 | 0 |
No single line can separate the 1s from the 0s!
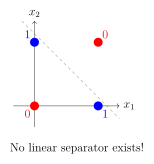
Solution: Use multiple perceptrons in layers \(\to\) Multi-Layer Perceptron (MLP) can learn XOR.
Historical note: This limitation caused the first “AI winter” in the 1970s. Minsky and Papert’s book (1969) highlighted these limitations, dampening enthusiasm until backpropagation was rediscovered in the 1980s.
15 Artificial Neural Networks
15.1 The Neuron Model
Definition 15.1 (Artificial Neuron). A neuron computes: \[a = f\left(\sum_{i=1}^d w_i x_i + b\right) = f(\boldsymbol{w}^\top\boldsymbol{x} + b)\] where:
\(\boldsymbol{x} = [x_1, \ldots, x_d]^\top\) are inputs
\(\boldsymbol{w} = [w_1, \ldots, w_d]^\top\) are weights
\(b\) is bias
\(f\) is the activation function
\(a\) is the neuron’s output (activation)
15.2 Activation Functions
Definition 15.2 (Common Activation Functions). 1. Sigmoid: \[\sigma(z) = \frac{1}{1 + e^{-z}}, \quad \sigma'(z) = \sigma(z)(1-\sigma(z))\] Range: \((0, 1)\). Used in output layer for binary classification.
2. Hyperbolic Tangent (Tanh): \[\tanh(z) = \frac{e^z - e^{-z}}{e^z + e^{-z}}, \quad \tanh'(z) = 1 - \tanh^2(z)\] Range: \((-1, 1)\). Zero-centered (better than sigmoid for hidden layers).
3. ReLU (Rectified Linear Unit): \[\text{ReLU}(z) = \max(0, z), \quad \text{ReLU}'(z) = \begin{cases} 1 & z > 0 \\ 0 & z \leq 0 \end{cases}\] Most popular for hidden layers. Fast, addresses vanishing gradient.
4. Leaky ReLU: \[\text{LeakyReLU}(z) = \max(\alpha z, z), \quad \alpha \in (0, 1) \text{ typically } 0.01\] Prevents “dead neurons” (neurons that never activate).
5. GELU (Gaussian Error Linear Unit): \[\text{GELU}(z) = z \cdot \Phi(z)\] where \(\Phi\) is the Gaussian CDF. Smooth, used in Transformers (BERT, GPT).
6. Softmax (for output layer, multi-class): \[\text{softmax}(\boldsymbol{z})_i = \frac{e^{z_i}}{\sum_{j=1}^K e^{z_j}}\] Converts logits to probability distribution.
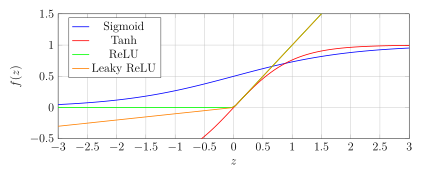
Why non-linear activations?
Without non-linearity, stacking layers is useless: \[f(\boldsymbol{W}_2 f(\boldsymbol{W}_1 \boldsymbol{x})) = f(\boldsymbol{W}_2 \boldsymbol{W}_1 \boldsymbol{x}) = f(\boldsymbol{W} \boldsymbol{x})\] Multiple linear layers collapse to a single linear transformation. Non-linear activations enable neural networks to approximate any continuous function (Universal Approximation Theorem).
Choosing activation:
Hidden layers: ReLU (default), Leaky ReLU, GELU
Output layer:
Binary classification: Sigmoid
Multi-class: Softmax
Regression: Linear (no activation)
15.3 Multi-Layer Perceptron (MLP)
Definition 15.3 (Feedforward Neural Network). An MLP with \(L\) layers has:
Input layer: \(\boldsymbol{x} = \boldsymbol{a}^{(0)} \in \mathbb{R}^{d_0}\)
Hidden layers \(\ell = 1, \ldots, L-1\): \[\boldsymbol{z}^{(\ell)} = \boldsymbol{W}^{(\ell)}\boldsymbol{a}^{(\ell-1)} + \boldsymbol{b}^{(\ell)}, \quad \boldsymbol{a}^{(\ell)} = f^{(\ell)}(\boldsymbol{z}^{(\ell)})\]
Output layer \(\ell = L\): \[\boldsymbol{z}^{(L)} = \boldsymbol{W}^{(L)}\boldsymbol{a}^{(L-1)} + \boldsymbol{b}^{(L)}, \quad \hat{\boldsymbol{y}} = \boldsymbol{a}^{(L)} = f^{(L)}(\boldsymbol{z}^{(L)})\]
where \(\boldsymbol{W}^{(\ell)} \in \mathbb{R}^{d_\ell \times d_{\ell-1}}\), \(\boldsymbol{b}^{(\ell)} \in \mathbb{R}^{d_\ell}\).
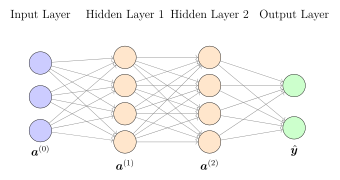
15.4 Forward Propagation
Forward Propagation Algorithm
Input: Example \(\boldsymbol{x}\), network parameters \(\{\boldsymbol{W}^{(\ell)}, \boldsymbol{b}^{(\ell)}\}_{\ell=1}^L\)
Initialize: \(\boldsymbol{a}^{(0)} = \boldsymbol{x}\)
For \(\ell = 1\) to \(L\):
Compute pre-activation: \(\boldsymbol{z}^{(\ell)} = \boldsymbol{W}^{(\ell)}\boldsymbol{a}^{(\ell-1)} + \boldsymbol{b}^{(\ell)}\)
Compute activation: \(\boldsymbol{a}^{(\ell)} = f^{(\ell)}(\boldsymbol{z}^{(\ell)})\)
Output: Prediction \(\hat{\boldsymbol{y}} = \boldsymbol{a}^{(L)}\)
15.5 Loss Functions
Definition 15.4 (Common Loss Functions). Regression (continuous output):
Mean Squared Error: \(\mathcal{L}= \frac{1}{n}\sum_{i=1}^n \left\lVert\boldsymbol{y}_i - \hat{\boldsymbol{y}}_i\right\rVert_2^2\)
Mean Absolute Error: \(\mathcal{L}= \frac{1}{n}\sum_{i=1}^n \left\lVert\boldsymbol{y}_i - \hat{\boldsymbol{y}}_i\right\rVert_1\)
Binary Classification:
Binary Cross-Entropy: \[\mathcal{L}= -\frac{1}{n}\sum_{i=1}^n [y_i\log(\hat{y}_i) + (1-y_i)\log(1-\hat{y}_i)]\]
Multi-Class Classification:
Categorical Cross-Entropy: \[\mathcal{L}= -\frac{1}{n}\sum_{i=1}^n \sum_{k=1}^K y_{ik}\log(\hat{y}_{ik})\] where \(\boldsymbol{y}_i\) is one-hot encoded.
15.6 Backpropagation
Backpropagation efficiently computes gradients using the chain rule.
Theorem 15.5 (Backpropagation Algorithm). For a network with \(L\) layers, we compute gradients backward from output to input.
Output layer gradient: \[\boldsymbol{\delta}^{(L)} = \nabla_{\boldsymbol{a}^{(L)}} \mathcal{L}\odot f'^{(L)}(\boldsymbol{z}^{(L)})\] where \(\odot\) is element-wise product.
Hidden layer gradients (for \(\ell = L-1, L-2, \ldots, 1\)): \[\boldsymbol{\delta}^{(\ell)} = (\boldsymbol{W}^{(\ell+1)})^\top \boldsymbol{\delta}^{(\ell+1)} \odot f'^{(\ell)}(\boldsymbol{z}^{(\ell)})\]
Parameter gradients: \[\nabla_{\boldsymbol{W}^{(\ell)}} \mathcal{L}= \boldsymbol{\delta}^{(\ell)} (\boldsymbol{a}^{(\ell-1)})^\top, \quad \nabla_{\boldsymbol{b}^{(\ell)}} \mathcal{L}= \boldsymbol{\delta}^{(\ell)}\]
Derivation Sketch. By chain rule, for layer \(\ell\): \[\frac{\partial \mathcal{L}}{\partial \boldsymbol{W}^{(\ell)}} = \frac{\partial \mathcal{L}}{\partial \boldsymbol{z}^{(\ell)}} \cdot \frac{\partial \boldsymbol{z}^{(\ell)}}{\partial \boldsymbol{W}^{(\ell)}}\] Define \(\boldsymbol{\delta}^{(\ell)} = \frac{\partial \mathcal{L}}{\partial \boldsymbol{z}^{(\ell)}}\) (the “error” at layer \(\ell\)).
For the output layer: \[\boldsymbol{\delta}^{(L)} = \frac{\partial \mathcal{L}}{\partial \boldsymbol{a}^{(L)}} \cdot \frac{\partial \boldsymbol{a}^{(L)}}{\partial \boldsymbol{z}^{(L)}} = \nabla_{\boldsymbol{a}^{(L)}} \mathcal{L}\odot f'^{(L)}(\boldsymbol{z}^{(L)})\]
For hidden layers, using chain rule through layer \(\ell+1\): \[\boldsymbol{\delta}^{(\ell)} = \frac{\partial \boldsymbol{z}^{(\ell+1)}}{\partial \boldsymbol{a}^{(\ell)}} \cdot \frac{\partial \mathcal{L}}{\partial \boldsymbol{z}^{(\ell+1)}} \cdot \frac{\partial \boldsymbol{a}^{(\ell)}}{\partial \boldsymbol{z}^{(\ell)}} = (\boldsymbol{W}^{(\ell+1)})^\top \boldsymbol{\delta}^{(\ell+1)} \odot f'^{(\ell)}(\boldsymbol{z}^{(\ell)})\]
Finally: \[\nabla_{\boldsymbol{W}^{(\ell)}} \mathcal{L}= \boldsymbol{\delta}^{(\ell)} (\boldsymbol{a}^{(\ell-1)})^\top\] ◻
Backpropagation Algorithm
Forward Pass: Compute all \(\boldsymbol{z}^{(\ell)}\) and \(\boldsymbol{a}^{(\ell)}\) for \(\ell = 1, \ldots, L\)
Backward Pass:
Compute output error: \(\boldsymbol{\delta}^{(L)} = \nabla_{\boldsymbol{a}^{(L)}} \mathcal{L}\odot f'^{(L)}(\boldsymbol{z}^{(L)})\)
For \(\ell = L-1\) down to \(1\):
Backpropagate error: \(\boldsymbol{\delta}^{(\ell)} = (\boldsymbol{W}^{(\ell+1)})^\top \boldsymbol{\delta}^{(\ell+1)} \odot f'^{(\ell)}(\boldsymbol{z}^{(\ell)})\)
Compute weight gradient: \(\nabla_{\boldsymbol{W}^{(\ell)}} \mathcal{L}= \boldsymbol{\delta}^{(\ell)} (\boldsymbol{a}^{(\ell-1)})^\top\)
Compute bias gradient: \(\nabla_{\boldsymbol{b}^{(\ell)}} \mathcal{L}= \boldsymbol{\delta}^{(\ell)}\)
Update: \(\boldsymbol{W}^{(\ell)} \leftarrow \boldsymbol{W}^{(\ell)} - \eta \nabla_{\boldsymbol{W}^{(\ell)}} \mathcal{L}\) for all layers
Why backpropagation is efficient:
Naive approach: Compute each partial derivative independently \(\to\) \(O(n \cdot p)\) where \(p\) is number of parameters.
Backpropagation: Compute all gradients in one backward pass \(\to\) \(O(p)\), roughly the same as one forward pass.
The key insight: Reuse intermediate computations. The error \(\boldsymbol{\delta}^{(\ell)}\) at layer \(\ell\) depends on \(\boldsymbol{\delta}^{(\ell+1)}\), so we propagate errors backward efficiently.
15.7 Vanishing and Exploding Gradients
Definition 15.6 (Gradient Vanishing). In deep networks with sigmoid/tanh activations, gradients can become very small as they propagate backward, making early layers learn very slowly.
Why? \(\sigma'(z) = \sigma(z)(1-\sigma(z)) \leq 0.25\). For a network with \(L\) layers: \[\frac{\partial \mathcal{L}}{\partial \boldsymbol{W}^{(1)}} \propto \prod_{\ell=1}^L \sigma'(z^{(\ell)}) \boldsymbol{W}^{(\ell)}\] If \(\sigma'(z) \approx 0.1\), then gradient \(\approx 0.1^L \to 0\) exponentially fast.
Definition 15.7 (Gradient Exploding). Conversely, if weights are large or activations unbounded, gradients can explode: \[\text{gradient} \propto \prod_{\ell} \boldsymbol{W}^{(\ell)} \to \infty\] Causes numerical instability, NaN values.
Solutions to Vanishing/Exploding Gradients:
1. Better Activation Functions:
ReLU: \(f'(z) = 1\) for \(z > 0\) (no vanishing in positive region)
Leaky ReLU, ELU: Address “dying ReLU” problem
2. Careful Weight Initialization:
Xavier/Glorot: \(\boldsymbol{W} \sim \mathcal{N}(0, 2/(d_{\text{in}} + d_{\text{out}}))\)
He initialization (for ReLU): \(\boldsymbol{W} \sim \mathcal{N}(0, 2/d_{\text{in}})\)
3. Batch Normalization: Normalize activations at each layer
4. Residual Connections (ResNet): Skip connections allow gradients to flow directly
5. Gradient Clipping: Cap gradients at a maximum value (for exploding)
6. LSTM/GRU: Specifically designed for RNNs to address vanishing gradients
16 Optimization in Deep Learning
16.1 Stochastic Gradient Descent Variants
16.1.1 Momentum
Definition 16.1 (SGD with Momentum). Accumulate past gradients to accelerate convergence: \[\boldsymbol{v}_t = \beta \boldsymbol{v}_{t-1} + \eta \nabla_{\boldsymbol{w}} \mathcal{L}, \quad \boldsymbol{w}_{t+1} = \boldsymbol{w}_t - \boldsymbol{v}_t\] Typical: \(\beta = 0.9\). Alternatively, some formulations use \(\boldsymbol{v}_t = \beta \boldsymbol{v}_{t-1} + \nabla_{\boldsymbol{w}} \mathcal{L}\) with \(\boldsymbol{w}_{t+1} = \boldsymbol{w}_t - \eta \boldsymbol{v}_t\).
Intuition 164. Momentum accelerates in directions with consistent gradients and dampens oscillations. Think of a ball rolling down a hill—it builds up speed in the downhill direction.
16.1.2 RMSProp
Definition 16.3 (RMSProp (Root Mean Square Propagation)). Adapt learning rate per parameter using moving average of squared gradients: \[\boldsymbol{s}_t = \beta \boldsymbol{s}_{t-1} + (1-\beta)(\nabla_{\boldsymbol{w}} \mathcal{L})^2, \quad \boldsymbol{w}_{t+1} = \boldsymbol{w}_t - \frac{\eta}{\sqrt{\boldsymbol{s}_t + \epsilon}} \odot \nabla_{\boldsymbol{w}} \mathcal{L}\] Typical: \(\beta = 0.9\), \(\epsilon = 10^{-8}\).
Intuition 166. RMSProp divides the learning rate by a running average of the gradient magnitude. Parameters with large gradients get smaller effective learning rates; parameters with small gradients get larger effective rates. This helps with different scales across parameters.
16.1.3 Adam
Definition 16.5 (Adam (Adaptive Moment Estimation)). Combines momentum and RMSProp: \[\begin{align} \boldsymbol{m}_t &= \beta_1 \boldsymbol{m}_{t-1} + (1-\beta_1)\nabla_{\boldsymbol{w}} \mathcal{L}&& \text{(first moment)} \\ \boldsymbol{v}_t &= \beta_2 \boldsymbol{v}_{t-1} + (1-\beta_2)(\nabla_{\boldsymbol{w}} \mathcal{L})^2 && \text{(second moment)} \\ \hat{\boldsymbol{m}}_t &= \frac{\boldsymbol{m}_t}{1 - \beta_1^t}, \quad \hat{\boldsymbol{v}}_t = \frac{\boldsymbol{v}_t}{1 - \beta_2^t} && \text{(bias correction)} \\ \boldsymbol{w}_{t+1} &= \boldsymbol{w}_t - \frac{\eta}{\sqrt{\hat{\boldsymbol{v}}_t} + \epsilon} \odot \hat{\boldsymbol{m}}_t \end{align}\] Typical: \(\beta_1 = 0.9\), \(\beta_2 = 0.999\), \(\eta = 0.001\), \(\epsilon = 10^{-8}\).
Adam is the default optimizer for deep learning:
Combines benefits of momentum (acceleration) and RMSProp (adaptive rates)
Works well across a wide range of problems
Bias correction ensures good estimates early in training
Relatively insensitive to hyperparameters
Variants:
AdamW: Adam with decoupled weight decay (better regularization)
AMSGrad: Fixes potential convergence issues in Adam
Nadam: Nesterov + Adam
16.2 Learning Rate Schedules
Definition 16.6 (Learning Rate Decay Strategies). 1. Step Decay: \[\eta_t = \eta_0 \cdot \gamma^{\lfloor t / k \rfloor}\] Drop learning rate by factor \(\gamma\) every \(k\) epochs.
2. Exponential Decay: \[\eta_t = \eta_0 e^{-\lambda t}\]
3. Cosine Annealing: \[\eta_t = \eta_{\min} + \frac{1}{2}(\eta_{\max} - \eta_{\min})\left(1 + \cos\left(\frac{t}{T}\pi\right)\right)\] Smoothly decreases from \(\eta_{\max}\) to \(\eta_{\min}\) over \(T\) steps.
4. Warm-up + Decay:
Linearly increase LR from 0 to \(\eta_0\) over first few epochs (warm-up)
Then apply decay schedule
Used in Transformers.
16.3 Batch Normalization
Definition 16.7 (Batch Normalization). For a mini-batch \(\mathcal{B} = \{\boldsymbol{x}_1, \ldots, \boldsymbol{x}_m\}\), normalize each feature: \[\begin{align} \mu_{\mathcal{B}} &= \frac{1}{m}\sum_{i=1}^m x_i \\ \sigma_{\mathcal{B}}^2 &= \frac{1}{m}\sum_{i=1}^m (x_i - \mu_{\mathcal{B}})^2 \\ \hat{x}_i &= \frac{x_i - \mu_{\mathcal{B}}}{\sqrt{\sigma_{\mathcal{B}}^2 + \epsilon}} \\ y_i &= \gamma \hat{x}_i + \beta \end{align}\] where \(\gamma\) and \(\beta\) are learnable parameters (scale and shift).
Benefits of Batch Normalization:
Faster training: Can use higher learning rates
Reduces internal covariate shift: Stabilizes distribution of layer inputs
Regularization effect: Adds noise (batch statistics), reduces overfitting
Less sensitive to initialization: Makes training more robust
Where to apply: After linear transformation, before activation: \[\boldsymbol{z} = \boldsymbol{W}\boldsymbol{a}^{(\ell-1)} + \boldsymbol{b} \to \text{BatchNorm}(\boldsymbol{z}) \to f(\cdot)\]
At test time: Use running averages of \(\mu\) and \(\sigma^2\) computed during training (no batch available).
16.4 Dropout
Definition 16.8 (Dropout). During training, randomly set activations to zero with probability \(p\) (typically 0.5): \[\tilde{a}_i = \begin{cases} 0 & \text{with probability } p \\ a_i / (1-p) & \text{with probability } 1-p \end{cases}\] At test time, use all neurons (no dropout).
Intuition 171. Dropout prevents co-adaptation of neurons. By randomly dropping neurons, the network cannot rely on any specific neurons, forcing it to learn robust features. It’s like training an ensemble of networks that share weights.
Dropout as Regularization:
Prevents overfitting, especially in fully-connected layers
Typical \(p\): 0.2-0.5 for hidden layers, 0-0.2 for input layer
Not typically used in convolutional layers (they have fewer parameters)
Can be viewed as approximate Bayesian inference
Variants:
DropConnect: Drop weights instead of activations
Spatial Dropout: For CNNs, drop entire feature maps
17 Deep Architectures
17.1 Convolutional Neural Networks (CNNs)
17.1.1 Motivation for CNNs
Problem with fully-connected networks for images:
Image \(32 \times 32 \times 3\) has 3072 pixels. Hidden layer with 1000 neurons \(\to\) 3M parameters just in first layer!
No spatial structure: treats pixels far apart the same as nearby pixels
Not translation invariant: must learn same feature at every location
CNNs exploit:
Local connectivity: Neurons connect to small spatial regions
Weight sharing: Same filter applied across entire image
Translation equivariance: Features detected anywhere in the image
17.1.2 Convolutional Layer
Definition 17.1 (Convolution Operation). For input \(\boldsymbol{X} \in \mathbb{R}^{H \times W \times C}\) and filter \(\boldsymbol{K} \in \mathbb{R}^{F \times F \times C}\): \[Y[i,j] = \sum_{di=0}^{F-1}\sum_{dj=0}^{F-1}\sum_{c=1}^C X[i+di, j+dj, c] \cdot K[di, dj, c] + b\] Apply this for all positions \((i,j)\) to get feature map \(\boldsymbol{Y}\).
With \(D\) filters, output has shape \((H', W', D)\) where: \[H' = \frac{H - F + 2P}{S} + 1, \quad W' = \frac{W - F + 2P}{S} + 1\] \(P\) = padding, \(S\) = stride.
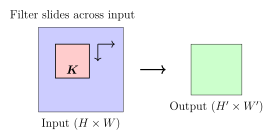
Key Concepts:
1. Receptive Field: Region of input that affects one output neuron. Deeper layers have larger receptive fields.
2. Padding:
Valid (no padding): Output size decreases
Same (pad to maintain size): \(P = (F-1)/2\) for stride 1
3. Stride: Step size. Larger stride \(\to\) smaller output, reduces computation.
4. Number of Parameters: For filter \(F \times F \times C\) with \(D\) filters: \[\text{params} = (F \times F \times C + 1) \times D\] Much smaller than fully-connected layer!
17.1.3 Pooling Layers
Definition 17.2 (Pooling). Downsampling operation to reduce spatial dimensions:
Max Pooling: Take maximum in each region \[Y[i,j] = \max_{di,dj} X[i \cdot S + di, j \cdot S + dj]\]
Average Pooling: Take average \[Y[i,j] = \frac{1}{F^2}\sum_{di,dj} X[i \cdot S + di, j \cdot S + dj]\]
Common: \(2 \times 2\) pooling with stride 2 (halves dimensions).
Benefits of pooling:
Reduces computation and memory
Provides translation invariance
Increases receptive field
17.1.4 Common CNN Architectures
Example 17.3 (LeNet-5 (1998) - Digit Recognition). Input (32×32) → Conv(6 filters, 5×5) → Pool(2×2) → Conv(16 filters, 5×5) → Pool(2×2) → FC(120) → FC(84) → FC(10)
First successful CNN, used for ZIP code recognition.
Example 17.4 (AlexNet (2012) - ImageNet Winner).
8 layers (5 conv, 3 FC)
ReLU activation (first major use)
Dropout for regularization
Data augmentation
60M parameters, reduced top-5 error from 26% to 15.3%
Marked the beginning of the deep learning revolution.
Example 17.5 (VGGNet (2014)).
Very deep (16-19 layers)
Only \(3 \times 3\) convolutions (smaller filters, stacked)
Showed depth is crucial
138M parameters (VGG-16)
Example 17.6 (ResNet (2015) - 152 Layers). Key innovation: Residual Connections
Instead of learning \(\mathcal{H}(\boldsymbol{x})\), learn residual \(\mathcal{F}(\boldsymbol{x})\) where: \[\mathcal{H}(\boldsymbol{x}) = \mathcal{F}(\boldsymbol{x}) + \boldsymbol{x}\] Skip connections allow gradients to flow directly, enabling very deep networks.
Won ImageNet 2015, error rate 3.6% (below human performance!).
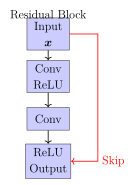
17.2 Recurrent Neural Networks (RNNs)
17.2.1 Sequence Modeling
Motivation: Many problems involve sequences:
Text: “The cat sat on the ___” (predict next word)
Time series: Stock prices, weather data
Speech: Audio to text
Video: Frame-by-frame analysis
Challenge: Variable-length inputs and dependencies between timesteps.
17.2.2 Vanilla RNN
Definition 17.7 (Recurrent Neural Network). At timestep \(t\): \[\begin{align} \boldsymbol{h}_t &= f(\boldsymbol{W}_{hh}\boldsymbol{h}_{t-1} + \boldsymbol{W}_{xh}\boldsymbol{x}_t + \boldsymbol{b}_h) \\ \boldsymbol{y}_t &= \boldsymbol{W}_{hy}\boldsymbol{h}_t + \boldsymbol{b}_y \end{align}\] where:
\(\boldsymbol{x}_t\): input at time \(t\)
\(\boldsymbol{h}_t\): hidden state (memory)
\(\boldsymbol{y}_t\): output at time \(t\)
\(f\): activation (typically tanh or ReLU)
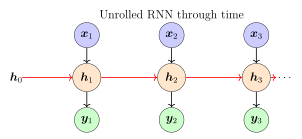
17.2.3 Backpropagation Through Time (BPTT)
Training RNNs: Unfold network through time and apply backpropagation. Gradients flow backward through all timesteps.
Problem: Vanishing gradients are even worse in RNNs! \[\frac{\partial \mathcal{L}}{\partial \boldsymbol{h}_1} \propto \prod_{t=2}^T \frac{\partial \boldsymbol{h}_t}{\partial \boldsymbol{h}_{t-1}} = \prod_{t=2}^T \boldsymbol{W}_{hh} \cdot f'(\boldsymbol{z}_t)\] For long sequences (\(T\) large), gradient vanishes or explodes exponentially.
17.2.4 LSTM (Long Short-Term Memory)
Definition 17.8 (LSTM Cell). LSTM uses gates to control information flow:
Forget gate: What to forget from cell state \[\boldsymbol{f}_t = \sigma(\boldsymbol{W}_f[\boldsymbol{h}_{t-1}, \boldsymbol{x}_t] + \boldsymbol{b}_f)\]
Input gate: What new information to add \[\boldsymbol{i}_t = \sigma(\boldsymbol{W}_i[\boldsymbol{h}_{t-1}, \boldsymbol{x}_t] + \boldsymbol{b}_i)\] \[\tilde{\boldsymbol{c}}_t = \tanh(\boldsymbol{W}_c[\boldsymbol{h}_{t-1}, \boldsymbol{x}_t] + \boldsymbol{b}_c)\]
Cell state update: \[\boldsymbol{c}_t = \boldsymbol{f}_t \odot \boldsymbol{c}_{t-1} + \boldsymbol{i}_t \odot \tilde{\boldsymbol{c}}_t\]
Output gate: What to output \[\boldsymbol{o}_t = \sigma(\boldsymbol{W}_o[\boldsymbol{h}_{t-1}, \boldsymbol{x}_t] + \boldsymbol{b}_o)\] \[\boldsymbol{h}_t = \boldsymbol{o}_t \odot \tanh(\boldsymbol{c}_t)\]
Why LSTM works:
Cell state \(\boldsymbol{c}_t\) acts as a “conveyor belt” for information
Gates (sigmoid \(\in [0,1]\)) control what flows through
Forget gate can preserve gradients over long sequences
Addresses vanishing gradient problem
When to use LSTM:
Long sequences (>50-100 timesteps)
Long-term dependencies matter
Text generation, machine translation, speech recognition
17.2.5 GRU (Gated Recurrent Unit)
Definition 17.9 (GRU). Simplified version of LSTM with fewer parameters:
Update gate: \[\boldsymbol{z}_t = \sigma(\boldsymbol{W}_z[\boldsymbol{h}_{t-1}, \boldsymbol{x}_t])\]
Reset gate: \[\boldsymbol{r}_t = \sigma(\boldsymbol{W}_r[\boldsymbol{h}_{t-1}, \boldsymbol{x}_t])\]
Candidate hidden state: \[\tilde{\boldsymbol{h}}_t = \tanh(\boldsymbol{W}[\boldsymbol{r}_t \odot \boldsymbol{h}_{t-1}, \boldsymbol{x}_t])\]
Hidden state update: \[\boldsymbol{h}_t = (1 - \boldsymbol{z}_t) \odot \boldsymbol{h}_{t-1} + \boldsymbol{z}_t \odot \tilde{\boldsymbol{h}}_t\]
GRU vs LSTM:
GRU: Simpler, fewer parameters, faster training
LSTM: More expressive, better for very long sequences
Performance often similar—try both!
17.3 Transformers and Attention
17.3.1 Limitations of RNNs
Sequential computation: Cannot parallelize (must process \(t-1\) before \(t\))
Long-range dependencies: Still struggle despite LSTM/GRU
Fixed hidden state: Must compress entire history into \(\boldsymbol{h}_t\)
Solution: Attention mechanism—directly access any part of the input.
17.3.2 Attention Mechanism
Definition 17.10 (Attention). Given query \(\boldsymbol{q}\), keys \(\boldsymbol{K} = [\boldsymbol{k}_1, \ldots, \boldsymbol{k}_n]\), and values \(\boldsymbol{V} = [\boldsymbol{v}_1, \ldots, \boldsymbol{v}_n]\):
1. Compute attention scores: \[e_i = \text{score}(\boldsymbol{q}, \boldsymbol{k}_i)\] Common: \(\text{score}(\boldsymbol{q}, \boldsymbol{k}) = \boldsymbol{q}^\top\boldsymbol{k}\) (dot product)
2. Normalize to get attention weights: \[\alpha_i = \frac{\exp(e_i)}{\sum_j \exp(e_j)} \quad \text{(softmax)}\]
3. Compute weighted sum: \[\text{context} = \sum_{i=1}^n \alpha_i \boldsymbol{v}_i\]
Intuition 182. Attention allows the model to “focus” on relevant parts of the input. For translation, when generating word \(t\), attention looks at all source words and focuses on the most relevant ones.
17.3.3 Scaled Dot-Product Attention
Definition 17.12 (Scaled Dot-Product Attention). \[\text{Attention}(\boldsymbol{Q}, \boldsymbol{K}, \boldsymbol{V}) = \text{softmax}\left(\frac{\boldsymbol{Q}\boldsymbol{K}^\top}{\sqrt{d_k}}\right)\boldsymbol{V}\] where \(\boldsymbol{Q} \in \mathbb{R}^{n \times d_k}\), \(\boldsymbol{K} \in \mathbb{R}^{m \times d_k}\), \(\boldsymbol{V} \in \mathbb{R}^{m \times d_v}\).
Scaling by \(\sqrt{d_k}\) prevents softmax saturation for large \(d_k\).
17.3.4 Transformer Architecture
Definition 17.13 (Transformer (Vaswani et al., 2017)). Uses only attention mechanisms (no recurrence):
Key components:
Multi-Head Attention: Multiple attention operations in parallel \[\text{MultiHead}(\boldsymbol{Q}, \boldsymbol{K}, \boldsymbol{V}) = \text{Concat}(\text{head}_1, \ldots, \text{head}_h)\boldsymbol{W}^O\] where \(\text{head}_i = \text{Attention}(\boldsymbol{Q}\boldsymbol{W}_i^Q, \boldsymbol{K}\boldsymbol{W}_i^K, \boldsymbol{V}\boldsymbol{W}_i^V)\)
Positional Encoding: Add position information (since no recurrence) \[PE_{(pos, 2i)} = \sin(pos/10000^{2i/d}), \quad PE_{(pos, 2i+1)} = \cos(pos/10000^{2i/d})\]
Feed-Forward Networks: Applied position-wise \[\text{FFN}(\boldsymbol{x}) = \max(0, \boldsymbol{x}\boldsymbol{W}_1 + \boldsymbol{b}_1)\boldsymbol{W}_2 + \boldsymbol{b}_2\]
Layer Normalization and Residual Connections
Why Transformers Revolutionized NLP:
Parallelization: All positions processed simultaneously
Long-range dependencies: Direct connections between any positions
Scalability: Can train on massive datasets efficiently
Transfer learning: Pre-train on large corpus, fine-tune on task
Impact:
BERT (2018): Bidirectional Transformer for language understanding
GPT series (2018-2023): Decoder-only Transformers for generation
Vision Transformers (ViT): Applied to images
Now the dominant architecture in NLP and increasingly in vision
17.4 Summary of Part 4
Perceptron: First neural network model. Linear classifier with convergence guarantee for separable data. Cannot learn XOR (not linearly separable).
MLPs: Stack layers with non-linear activations. Universal approximators. Trained via backpropagation—efficient gradient computation using chain rule.
Activation Functions: ReLU is default for hidden layers (addresses vanishing gradients). Sigmoid/Softmax for output. GELU in modern architectures.
Optimization: Adam is standard optimizer. Learning rate schedules improve convergence. Batch normalization and dropout for regularization.
CNNs: Exploit spatial structure via convolution and pooling. Weight sharing reduces parameters. ResNet’s skip connections enable very deep networks.
RNNs: Process sequences with recurrent connections. Vanilla RNNs suffer from vanishing gradients. LSTM/GRU use gates to maintain long-term memory.
Transformers: Attention mechanism allows direct access to all inputs. Fully parallelizable, handles long-range dependencies. Dominant architecture in modern NLP and increasingly in vision.
Next Steps: Part 5 explores unsupervised learning: clustering, dimensionality reduction, and methods for discovering structure without labels.
Exercise 17.14.
Prove that a single-layer perceptron cannot learn the XOR function. Show that a two-layer network with 2 hidden neurons can learn it.
Derive the backpropagation equations for a 3-layer network with sigmoid activations and MSE loss.
For a conv layer with input \(32 \times 32 \times 3\), filter size \(5 \times 5\), 64 filters, stride 1, padding 2: compute output dimensions and number of parameters.
Explain why ReLU helps with vanishing gradients compared to sigmoid. What is the “dying ReLU” problem?
Implement gradient descent with momentum by hand for \(f(x) = x^2\), starting from \(x_0 = 10\), with \(\eta = 0.1\), \(\beta = 0.9\). Show 5 iterations.
In an LSTM, what happens if the forget gate outputs all 1s? All 0s?
For scaled dot-product attention with \(d_k = 64\), why do we divide by \(\sqrt{64} = 8\)? What happens without scaling?
Compare computational complexity: training a 10-layer RNN vs a 10-layer Transformer on a sequence of length 100. Which is faster and why?
Part 5: Unsupervised Learning
18 Introduction to Unsupervised Learning
Definition 18.1 (Unsupervised Learning). In unsupervised learning, we have only input data \(\mathcal{D} = \{\boldsymbol{x}_1, \boldsymbol{x}_2, \ldots, \boldsymbol{x}_n\}\) without labels. The goal is to discover hidden structure or patterns in the data.
Main Tasks in Unsupervised Learning:
Clustering: Group similar examples together
Dimensionality Reduction: Find lower-dimensional representations
Density Estimation: Model the probability distribution \(P(\boldsymbol{x})\)
Anomaly Detection: Identify unusual or outlier examples
Association Rules: Discover relationships between variables
Why Unsupervised Learning?
Labeled data is expensive; unlabeled data is abundant
Discover hidden structures humans might miss
Preprocessing for supervised learning (feature extraction)
Understand data distribution and relationships
19 Clustering
19.1 K-Means Clustering
19.1.1 Problem Formulation
Definition 19.1 (K-Means Objective). Given data \(\{\boldsymbol{x}_i\}_{i=1}^n\) and desired number of clusters \(K\), find:
Cluster centers (centroids) \(\{\boldsymbol{\mu}_k\}_{k=1}^K\)
Cluster assignments \(\{c_i\}_{i=1}^n\) where \(c_i \in \{1, \ldots, K\}\)
to minimize within-cluster sum of squares: \[J = \sum_{i=1}^n \left\lVert\boldsymbol{x}_i - \boldsymbol{\mu}_{c_i}\right\rVert_2^2 = \sum_{k=1}^K \sum_{i: c_i=k} \left\lVert\boldsymbol{x}_i - \boldsymbol{\mu}_k\right\rVert_2^2\]
Intuition 188. K-means finds \(K\) cluster centers and assigns each point to its nearest center. The objective minimizes the total distance from points to their assigned centers—we want tight, compact clusters.
19.1.2 Lloyd’s Algorithm
K-Means Algorithm (Lloyd’s Algorithm)
Input: Data \(\{\boldsymbol{x}_i\}_{i=1}^n\), number of clusters \(K\), max iterations \(T\)
Initialize: Randomly select \(K\) points as initial centroids \(\{\boldsymbol{\mu}_k\}_{k=1}^K\)
Repeat until convergence (or \(T\) iterations):
Assignment step: Assign each point to nearest centroid \[c_i = \mathop{\mathrm{arg\,min}}_{k \in \{1,\ldots,K\}} \left\lVert\boldsymbol{x}_i - \boldsymbol{\mu}_k\right\rVert_2^2\]
Update step: Recompute centroids as mean of assigned points \[\boldsymbol{\mu}_k = \frac{1}{|C_k|}\sum_{i \in C_k} \boldsymbol{x}_i\] where \(C_k = \{i : c_i = k\}\) is the set of points assigned to cluster \(k\).
Check convergence: If assignments don’t change, stop
Output: Cluster centers \(\{\boldsymbol{\mu}_k\}\) and assignments \(\{c_i\}\)
Theorem 19.3 (K-Means Convergence). Lloyd’s algorithm is guaranteed to converge to a local minimum of \(J\). The objective decreases (or stays the same) at each iteration:
Assignment step: Each point moves to nearest center \(\to\) \(J\) decreases
Update step: Each center moves to mean of its cluster \(\to\) \(J\) decreases
Since \(J \geq 0\) and there are finitely many possible assignments, the algorithm must converge.
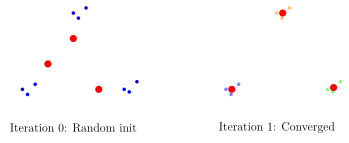
Initialization Matters!
K-means finds a local minimum, which depends on initialization.
K-Means++ Initialization:
Choose first center uniformly at random
For each subsequent center, choose point with probability proportional to squared distance from nearest existing center
Repeat until \(K\) centers chosen
This spreads out initial centers, leading to better final clusters.
Multiple Runs: Run K-means multiple times (10-100) with different initializations, keep the best result (lowest \(J\)).
19.1.3 Choosing K (Number of Clusters)
Definition 19.4 (Elbow Method). Plot \(J\) (within-cluster sum of squares) vs \(K\). Look for an “elbow”—a point where \(J\) stops decreasing rapidly.
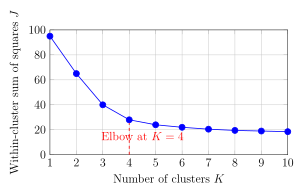
Definition 19.5 (Silhouette Score). For each point \(i\), compute:
\(a_i\): Average distance to other points in same cluster
\(b_i\): Average distance to points in nearest other cluster
Silhouette coefficient: \[s_i = \frac{b_i - a_i}{\max(a_i, b_i)} \in [-1, 1]\]
\(s_i \approx 1\): Well clustered (far from other clusters)
\(s_i \approx 0\): On boundary between clusters
\(s_i < 0\): Possibly assigned to wrong cluster
Silhouette score: Average \(s_i\) over all points. Higher is better.
19.1.4 Advantages and Limitations
Advantages of K-Means:
Simple, intuitive, easy to implement
Fast: \(O(nKdT)\) where \(T\) is number of iterations (usually small)
Scales to large datasets
Works well for spherical, well-separated clusters
Limitations:
Must specify \(K\) in advance
Assumes spherical clusters of similar size
Sensitive to outliers
Sensitive to initialization (local minima)
Only uses Euclidean distance
Poor with non-convex cluster shapes
Variants:
K-Medoids: Use actual data points as centers (more robust to outliers)
Fuzzy C-Means: Soft assignments (points can belong to multiple clusters)
K-Means||: Parallelizable version for big data
19.2 Hierarchical Clustering
Definition 19.6 (Hierarchical Clustering). Build a tree (dendrogram) of nested clusters. Two approaches:
Agglomerative (bottom-up): Start with each point as its own cluster, merge closest pairs
Divisive (top-down): Start with all points in one cluster, recursively split
Agglomerative is more common.
19.2.1 Agglomerative Clustering
Agglomerative Hierarchical Clustering
Input: Data \(\{\boldsymbol{x}_i\}_{i=1}^n\), linkage criterion
Initialize: Each point is its own cluster: \(C_i = \{\boldsymbol{x}_i\}\) for \(i=1,\ldots,n\)
Repeat until one cluster remains:
Find the two closest clusters \(C_i\) and \(C_j\) according to linkage criterion
Merge them: \(C_{\text{new}} = C_i \cup C_j\)
Remove \(C_i\) and \(C_j\), add \(C_{\text{new}}\)
Output: Dendrogram (tree of merges)
Definition 19.7 (Linkage Criteria). How to measure distance between clusters?
1. Single Linkage (minimum): \[d(C_i, C_j) = \min_{\boldsymbol{x} \in C_i, \boldsymbol{z} \in C_j} \left\lVert\boldsymbol{x} - \boldsymbol{z}\right\rVert\] Distance between closest points. Tends to create long, chain-like clusters.
2. Complete Linkage (maximum): \[d(C_i, C_j) = \max_{\boldsymbol{x} \in C_i, \boldsymbol{z} \in C_j} \left\lVert\boldsymbol{x} - \boldsymbol{z}\right\rVert\] Distance between farthest points. Creates compact, spherical clusters.
3. Average Linkage: \[d(C_i, C_j) = \frac{1}{|C_i||C_j|}\sum_{\boldsymbol{x} \in C_i}\sum_{\boldsymbol{z} \in C_j} \left\lVert\boldsymbol{x} - \boldsymbol{z}\right\rVert\] Average distance between all pairs.
4. Ward’s Method: Minimize increase in within-cluster variance when merging. Most popular choice. \[d(C_i, C_j) = \frac{|C_i||C_j|}{|C_i| + |C_j|} \left\lVert\boldsymbol{\mu}_i - \boldsymbol{\mu}_j\right\rVert^2\]
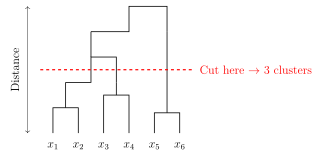
Advantages of Hierarchical Clustering:
No need to specify \(K\) in advance
Dendrogram provides full hierarchy
Deterministic (no random initialization)
Can handle any distance metric
Intuitive visualization
Limitations:
Computational cost: \(O(n^3)\) time, \(O(n^2)\) space
Cannot scale to large datasets (millions of points)
Greedy: Cannot undo merges
Sensitive to noise and outliers
When to use:
Small to medium datasets (\(n < 10,000\))
When you want to explore different numbers of clusters
When hierarchy itself is meaningful (taxonomy, phylogenetic trees)
19.3 DBSCAN (Density-Based Clustering)
Definition 19.8 (DBSCAN). DBSCAN (Density-Based Spatial Clustering of Applications with Noise) clusters based on density. Two parameters:
\(\epsilon\): Neighborhood radius
\(\text{minPts}\): Minimum points to form a dense region
Point types:
Core point: Has \(\geq \text{minPts}\) points within distance \(\epsilon\)
Border point: Within \(\epsilon\) of a core point, but not core itself
Noise point: Neither core nor border
DBSCAN Algorithm
Input: Data \(\{\boldsymbol{x}_i\}\), \(\epsilon\), \(\text{minPts}\)
Initialize: All points unmarked, cluster counter \(C = 0\)
For each unmarked point \(\boldsymbol{x}_i\):
Find \(N_\epsilon(\boldsymbol{x}_i) = \{\boldsymbol{x}_j : \left\lVert\boldsymbol{x}_i - \boldsymbol{x}_j\right\rVert \leq \epsilon\}\) (neighbors)
If \(|N_\epsilon(\boldsymbol{x}_i)| < \text{minPts}\):
Mark \(\boldsymbol{x}_i\) as noise (for now)
Else (\(\boldsymbol{x}_i\) is core point):
\(C = C + 1\) (new cluster)
Mark \(\boldsymbol{x}_i\) with cluster \(C\)
Initialize queue \(Q = N_\epsilon(\boldsymbol{x}_i)\)
While \(Q\) not empty:
Pop \(\boldsymbol{x}_j\) from \(Q\)
If \(\boldsymbol{x}_j\) was noise: mark with cluster \(C\) (border point)
If \(\boldsymbol{x}_j\) unmarked: mark with cluster \(C\)
If \(\boldsymbol{x}_j\) is core point: add its neighbors to \(Q\)
Output: Cluster assignments (or noise label)
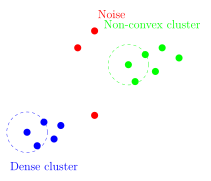
Advantages of DBSCAN:
Discovers arbitrary shapes: Not limited to spherical clusters
Handles noise: Explicitly identifies outliers
No need to specify \(K\): Number of clusters determined automatically
Only two parameters: \(\epsilon\) and minPts
Limitations:
Sensitive to \(\epsilon\) and minPts (hard to tune)
Struggles with varying densities
\(O(n^2)\) complexity (can use KD-trees to reduce to \(O(n\log n)\))
Border points can be assigned arbitrarily if equidistant to multiple clusters
Parameter selection:
minPts: Often set to \(2d\) where \(d\) is dimensionality, or 4-5 for 2D data
\(\epsilon\): Plot k-distance graph (distance to \(k\)-th nearest neighbor), look for “knee”
19.4 Cluster Evaluation Metrics
When ground truth labels are unavailable:
Definition 19.9 (Davies-Bouldin Index). \[\text{DB} = \frac{1}{K}\sum_{i=1}^K \max_{j \neq i} \left(\frac{s_i + s_j}{d_{ij}}\right)\] where \(s_i\) is average distance within cluster \(i\), and \(d_{ij}\) is distance between cluster centers.
Lower is better (smaller within-cluster spread, larger between-cluster separation).
Definition 19.10 (Calinski-Harabasz Index (Variance Ratio)). \[\text{CH} = \frac{\text{Between-cluster variance}}{\text{Within-cluster variance}} \cdot \frac{n - K}{K - 1}\] Higher is better (better separation).
When ground truth labels are available:
Definition 19.11 (Adjusted Rand Index (ARI)). Measures agreement between predicted clusters and true labels, adjusted for chance. \[\text{ARI} \in [-1, 1]\]
ARI = 1: Perfect agreement
ARI = 0: Random assignment
ARI < 0: Worse than random
20 Dimensionality Reduction
20.1 Motivation
The Curse of Dimensionality:
Data in high dimensions is sparse (most volume in corners of hypercube)
Distance metrics become less meaningful
Overfitting becomes severe
Computational cost grows exponentially
Benefits of Dimensionality Reduction:
Visualization (reduce to 2D or 3D)
Noise reduction (eliminate irrelevant features)
Faster training (fewer features)
Storage efficiency
Avoid overfitting
Two approaches:
Feature Selection: Select subset of original features
Feature Extraction: Create new features as combinations of originals
20.2 Principal Component Analysis (PCA)
20.2.1 Intuition and Formulation
Definition 20.1 (PCA Goal). Find a low-dimensional linear subspace that captures maximum variance in the data.
Formally, find \(k\) orthogonal directions \(\{\boldsymbol{u}_1, \ldots, \boldsymbol{u}_k\}\) that maximize: \[\max_{\boldsymbol{u}_1, \ldots, \boldsymbol{u}_k} \sum_{j=1}^k \mathrm{Var}(\boldsymbol{x}^\top \boldsymbol{u}_j)\] subject to \(\left\lVert\boldsymbol{u}_j\right\rVert = 1\) and \(\boldsymbol{u}_i \perp \boldsymbol{u}_j\) for \(i \neq j\).
Intuition 199. PCA finds new coordinate axes (principal components) along which data has maximum spread. The first component captures the most variance, the second captures the most remaining variance (orthogonal to the first), and so on.
Think of a 3D cloud of points shaped like a pancake. PCA finds the plane that best fits the pancake, and potentially a line within that plane.
Theorem 20.3 (PCA via Eigendecomposition). Given centered data (mean subtracted), the principal components are the eigenvectors of the covariance matrix \(\boldsymbol{\Sigma} = \frac{1}{n}\boldsymbol{X}^\top\boldsymbol{X}\).
Steps:
Center data: \(\tilde{\boldsymbol{x}}_i = \boldsymbol{x}_i - \bar{\boldsymbol{x}}\) where \(\bar{\boldsymbol{x}} = \frac{1}{n}\sum_i \boldsymbol{x}_i\)
Compute covariance: \(\boldsymbol{\Sigma} = \frac{1}{n}\sum_{i=1}^n \tilde{\boldsymbol{x}}_i\tilde{\boldsymbol{x}}_i^\top\)
Eigendecomposition: \(\boldsymbol{\Sigma} = \boldsymbol{U}\boldsymbol{\Lambda}\boldsymbol{U}^\top\)
Sort eigenvalues \(\lambda_1 \geq \lambda_2 \geq \cdots \geq \lambda_d\)
Top \(k\) eigenvectors \(\{\boldsymbol{u}_1, \ldots, \boldsymbol{u}_k\}\) are principal components
Projection: \(\boldsymbol{z}_i = \boldsymbol{U}_k^\top \tilde{\boldsymbol{x}}_i \in \mathbb{R}^k\) where \(\boldsymbol{U}_k = [\boldsymbol{u}_1, \ldots, \boldsymbol{u}_k]\).
Reconstruction: \(\hat{\boldsymbol{x}}_i = \boldsymbol{U}_k \boldsymbol{z}_i + \bar{\boldsymbol{x}}\).
Sketch. We want to maximize \(\sum_i (\boldsymbol{u}_1^\top \tilde{\boldsymbol{x}}_i)^2 = \boldsymbol{u}_1^\top \left(\sum_i \tilde{\boldsymbol{x}}_i\tilde{\boldsymbol{x}}_i^\top\right)\boldsymbol{u}_1 = \boldsymbol{u}_1^\top \boldsymbol{\Sigma} \boldsymbol{u}_1\).
Using Lagrange multipliers for constraint \(\left\lVert\boldsymbol{u}_1\right\rVert = 1\): \[\mathcal{L} = \boldsymbol{u}_1^\top \boldsymbol{\Sigma} \boldsymbol{u}_1 - \lambda(\boldsymbol{u}_1^\top\boldsymbol{u}_1 - 1)\] Taking derivative and setting to zero: \[\boldsymbol{\Sigma}\boldsymbol{u}_1 = \lambda\boldsymbol{u}_1\] So \(\boldsymbol{u}_1\) is an eigenvector of \(\boldsymbol{\Sigma}\). To maximize variance, choose eigenvector with largest eigenvalue \(\lambda_1\). The variance captured is \(\lambda_1\). Repeat for subsequent components (orthogonal eigenvectors). ◻
PCA Algorithm
Input: Data \(\boldsymbol{X} \in \mathbb{R}^{n \times d}\), target dimension \(k\)
Center data: \(\tilde{\boldsymbol{X}} = \boldsymbol{X} - \bar{\boldsymbol{x}}\mathbf{1}^\top\) where \(\bar{\boldsymbol{x}} = \frac{1}{n}\sum_i \boldsymbol{x}_i\)
Compute covariance: \(\boldsymbol{\Sigma} = \frac{1}{n}\tilde{\boldsymbol{X}}^\top\tilde{\boldsymbol{X}}\)
Compute eigenvectors/eigenvalues: \(\boldsymbol{\Sigma} = \boldsymbol{U}\boldsymbol{\Lambda}\boldsymbol{U}^\top\)
Sort eigenvalues in descending order
Select top \(k\) eigenvectors: \(\boldsymbol{U}_k = [\boldsymbol{u}_1, \ldots, \boldsymbol{u}_k]\)
Project data: \(\boldsymbol{Z} = \tilde{\boldsymbol{X}}\boldsymbol{U}_k\)
Output: Reduced data \(\boldsymbol{Z} \in \mathbb{R}^{n \times k}\), transformation \(\boldsymbol{U}_k\)
20.2.2 Choosing Number of Components
Definition 20.4 (Explained Variance Ratio). Proportion of total variance captured by first \(k\) components: \[\text{EVR}_k = \frac{\sum_{j=1}^k \lambda_j}{\sum_{j=1}^d \lambda_j}\] Common threshold: Keep enough components to explain 90-95% of variance.
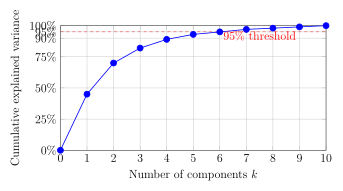
20.2.3 PCA Properties and Limitations
Key Properties of PCA:
Linear transformation: \(\boldsymbol{z} = \boldsymbol{U}_k^\top(\boldsymbol{x} - \bar{\boldsymbol{x}})\)
Optimal reconstruction: Minimizes reconstruction error \(\sum_i \left\lVert\boldsymbol{x}_i - \hat{\boldsymbol{x}}_i\right\rVert^2\)
Uncorrelated components: \(\mathrm{Cov}(\boldsymbol{z}_i, \boldsymbol{z}_j) = 0\) for \(i \neq j\)
Ordered by importance: First component captures most variance
Advantages:
Fast, closed-form solution (eigendecomposition)
Interpretable (variance explained)
No hyperparameters (except \(k\))
Reversible (can reconstruct)
Limitations:
Linear only: Cannot capture non-linear structure
Assumes variance = importance: High variance might be noise
Sensitive to scaling: Must standardize features first
Assumes Gaussian distribution: Works best for normally distributed data
Interpretability: Components are linear combinations, hard to interpret
When to use PCA:
Preprocessing for supervised learning
Visualization (project to 2D/3D)
Noise reduction
When features are correlated
20.3 Linear Discriminant Analysis (LDA)
Definition 20.5 (LDA). Unlike PCA (unsupervised), LDA is supervised dimensionality reduction. It finds directions that maximize separation between classes.
Goal: Find projection \(\boldsymbol{w}\) that maximizes: \[J(\boldsymbol{w}) = \frac{\text{Between-class variance}}{\text{Within-class variance}} = \frac{\boldsymbol{w}^\top \boldsymbol{S}_B \boldsymbol{w}}{\boldsymbol{w}^\top \boldsymbol{S}_W \boldsymbol{w}}\] where:
\(\boldsymbol{S}_W = \sum_{c=1}^K \sum_{i \in C_c} (\boldsymbol{x}_i - \boldsymbol{\mu}_c)(\boldsymbol{x}_i - \boldsymbol{\mu}_c)^\top\) (within-class scatter)
\(\boldsymbol{S}_B = \sum_{c=1}^K n_c (\boldsymbol{\mu}_c - \boldsymbol{\mu})(\boldsymbol{\mu}_c - \boldsymbol{\mu})^\top\) (between-class scatter)
Theorem 20.6 (LDA Solution). Optimal projection directions are eigenvectors of \(\boldsymbol{S}_W^{-1}\boldsymbol{S}_B\) corresponding to largest eigenvalues.
Maximum number of components: \(\min(d, K-1)\) where \(K\) is number of classes.
PCA vs LDA:
PCA: Unsupervised, maximizes variance, uses all data
LDA: Supervised, maximizes class separation, uses labels
When to use LDA:
Dimensionality reduction before classification
When classes are well-separated
When you have class labels
LDA often gives better results for classification tasks because it uses label information.
20.4 Non-Linear Methods
20.4.1 t-SNE (t-Distributed Stochastic Neighbor Embedding)
Definition 20.7 (t-SNE). Non-linear method that preserves local structure. Particularly good for visualization.
Idea:
In high-dimensional space, compute pairwise similarities: \[p_{ij} = \frac{\exp(-\left\lVert\boldsymbol{x}_i - \boldsymbol{x}_j\right\rVert^2 / 2\sigma^2)}{\sum_{k \neq l} \exp(-\left\lVert\boldsymbol{x}_k - \boldsymbol{x}_l\right\rVert^2 / 2\sigma^2)}\]
In low-dimensional space, use t-distribution: \[q_{ij} = \frac{(1 + \left\lVert\boldsymbol{z}_i - \boldsymbol{z}_j\right\rVert^2)^{-1}}{\sum_{k \neq l} (1 + \left\lVert\boldsymbol{z}_k - \boldsymbol{z}_l\right\rVert^2)^{-1}}\]
Minimize KL divergence: \(\text{KL}(P||Q) = \sum_{i,j} p_{ij}\log\frac{p_{ij}}{q_{ij}}\)
Optimized via gradient descent.
t-SNE Properties:
Excellent for visualization (clusters become very clear)
Preserves local structure (nearby points stay nearby)
Non-linear (can capture complex manifolds)
Stochastic (different runs give different results)
Cannot be applied to new data (no explicit mapping, must rerun)
Computationally expensive: \(O(n^2)\)
Hyperparameter sensitive (perplexity, learning rate)
When to use:
Visualization of high-dimensional data
Exploratory analysis
Not for preprocessing (use PCA for that)
Interpretation caution:
Cluster sizes don’t mean anything
Distances between clusters don’t mean anything
Only local structure (within clusters) is meaningful
20.4.2 UMAP (Uniform Manifold Approximation and Projection)
Definition 20.8 (UMAP). Similar goal to t-SNE but with better theoretical foundation (Riemannian geometry and algebraic topology).
Advantages over t-SNE:
Faster (\(O(n)\) vs \(O(n^2)\))
Better preserves global structure
Can be applied to new data (unlike t-SNE)
Scales to larger datasets
Often better separation of clusters
Popular for single-cell RNA-seq visualization and other large-scale applications.
20.4.3 Autoencoders
Definition 20.9 (Autoencoder). Neural network that learns to compress and reconstruct data.
Architecture:
Encoder: \(\boldsymbol{z} = f_{\text{enc}}(\boldsymbol{x}; \boldsymbol{\theta}_{\text{enc}})\) maps \(\boldsymbol{x} \in \mathbb{R}^d\) to \(\boldsymbol{z} \in \mathbb{R}^k\) (bottleneck)
Decoder: \(\hat{\boldsymbol{x}} = f_{\text{dec}}(\boldsymbol{z}; \boldsymbol{\theta}_{\text{dec}})\) reconstructs from \(\boldsymbol{z}\)
Training: Minimize reconstruction error: \[\mathcal{L}= \sum_{i=1}^n \left\lVert\boldsymbol{x}_i - \hat{\boldsymbol{x}}_i\right\rVert^2\]
Types of Autoencoders:
Undercomplete: Bottleneck \(k < d\) (forced to compress)
Sparse: Regularize activations in bottleneck
Denoising: Train to reconstruct from corrupted input
Variational (VAE): Learn probability distribution in latent space (generative model)
Advantages:
Non-linear (can capture complex structure)
Flexible architecture
Can handle any data type (images, text, etc.)
Can be applied to new data (just run encoder)
Limitations:
Requires training (no closed form)
Many hyperparameters
Can be slow to train
May overfit with limited data
21 Association Rule Learning
21.1 Market Basket Analysis
Definition 21.1 (Association Rules). Given transactions (sets of items), find rules of the form: \[X \Rightarrow Y\] meaning “if \(X\) is purchased, then \(Y\) is likely to be purchased.”
Example: \(\{\text{bread, butter}\} \Rightarrow \{\text{milk}\}\)
Definition 21.2 (Key Metrics). For rule \(X \Rightarrow Y\):
1. Support: \[\text{support}(X \Rightarrow Y) = P(X \cup Y) = \frac{\text{transactions containing } X \text{ and } Y}{\text{total transactions}}\] Measures how frequently the rule occurs.
2. Confidence: \[\text{confidence}(X \Rightarrow Y) = P(Y | X) = \frac{\text{support}(X \cup Y)}{\text{support}(X)}\] Measures reliability: if \(X\) is purchased, how often is \(Y\) also purchased?
3. Lift: \[\text{lift}(X \Rightarrow Y) = \frac{P(X \cup Y)}{P(X)P(Y)} = \frac{\text{confidence}(X \Rightarrow Y)}{\text{support}(Y)}\] Measures how much more likely \(Y\) is given \(X\) compared to \(Y\) alone.
Lift > 1: \(X\) and \(Y\) are positively correlated
Lift = 1: Independent
Lift < 1: Negatively correlated
Example 21.3 (Market Basket). Store with 1000 transactions:
Bread purchased: 600 times
Milk purchased: 500 times
Bread AND Milk: 400 times
For rule \(\{\text{bread}\} \Rightarrow \{\text{milk}\}\): \[\begin{align} \text{support} &= \frac{400}{1000} = 0.4 \\ \text{confidence} &= \frac{400}{600} = 0.67 \\ \text{lift} &= \frac{0.4}{0.6 \times 0.5} = 1.33 \end{align}\] People who buy bread are 33% more likely to buy milk than average.
21.2 Apriori Algorithm
Theorem 21.4 (Apriori Principle). If an itemset is frequent, then all of its subsets must also be frequent. Equivalently: \[\text{If } X \subseteq Y \text{ and } Y \text{ is infrequent, then } X \text{ is infrequent}\] This allows pruning the search space.
Apriori Algorithm
Input: Transactions \(\mathcal{T}\), minimum support threshold \(\text{minsup}\)
Initialize: \(L_1 = \{\text{frequent 1-itemsets}\}\) (items with support \(\geq\) minsup)
For \(k = 2, 3, \ldots\) until \(L_k = \emptyset\):
Generate candidates: \(C_k = \text{generate}(L_{k-1})\)
Join pairs in \(L_{k-1}\) that share \(k-2\) items
Prune candidates whose \((k-1)\)-subsets are not in \(L_{k-1}\)
Count support: Scan database to count support of each candidate in \(C_k\)
Filter: \(L_k = \{c \in C_k : \text{support}(c) \geq \text{minsup}\}\)
Output: All frequent itemsets \(L = \bigcup_k L_k\)
Generate rules: For each frequent itemset \(X\), generate rules \(X \setminus Y \Rightarrow Y\) for all \(Y \subset X\) with sufficient confidence.
Apriori Advantages:
Uses smart pruning to avoid checking all \(2^n\) itemsets
Guarantees finding all rules above thresholds
Simple and interpretable
Limitations:
Multiple database scans (one per level)
Generates many candidates
Not efficient for very large databases or low support thresholds
FP-Growth: More efficient alternative
Builds compressed data structure (FP-tree)
Only 2 database scans
No candidate generation
Faster than Apriori, especially for large dense datasets
21.3 Applications
Retail: Product placement, cross-selling, promotions
Web usage mining: Page navigation patterns
Bioinformatics: Gene co-occurrence, protein interactions
Healthcare: Symptom associations, drug interactions
21.4 Summary of Part 5
Clustering: Group similar points. K-means for spherical clusters (fast but needs \(K\)). Hierarchical for dendrograms (intuitive but slow). DBSCAN for arbitrary shapes and noise handling.
Cluster Evaluation: Silhouette score, Davies-Bouldin index (intrinsic). ARI when ground truth available.
PCA: Linear dimensionality reduction via eigendecomposition. Maximizes variance, fast, but linear only. Use for preprocessing and visualization.
LDA: Supervised dimensionality reduction. Maximizes class separation. Better than PCA for classification tasks.
t-SNE: Non-linear visualization. Excellent for exploratory analysis but cannot be applied to new data. Preserves local structure only.
UMAP: Similar to t-SNE but faster, better global structure preservation, and can transform new data.
Autoencoders: Neural network-based non-linear reduction. Flexible but requires training.
Association Rules: Find patterns in transaction data. Apriori algorithm with support/confidence/lift metrics. Applications in retail and beyond.
Next Steps: Part 6 covers model evaluation, selection, hyperparameter tuning, and practical aspects of deploying ML systems.
Exercise 21.5.
For K-means with data \(\{(1,1), (1,2), (5,5), (5,6)\}\) and \(K=2\), starting with centroids at \((1,1)\) and \((5,5)\), perform one complete iteration (assignment + update). What are the new centroids?
Show that the K-means objective \(J\) decreases (or stays the same) in both the assignment step and the update step.
For hierarchical clustering with complete linkage, compute the dendrogram for points \(\{(0,0), (1,0), (0,1), (5,5)\}\) using Euclidean distance.
Given covariance matrix \(\boldsymbol{\Sigma} = \begin{bmatrix} 4 & 2 \\ 2 & 2 \end{bmatrix}\), find the principal components (eigenvectors) and explained variance (eigenvalues).
Explain why PCA requires centering the data (subtracting the mean). What happens if you don’t center?
For transactions: \(\{A,B,C\}, \{A,B\}, \{A,C\}, \{B,C\}, \{B\}\), find all rules with minimum support 0.4 and minimum confidence 0.6.
Compare computational complexity: K-means, hierarchical clustering (complete linkage), and DBSCAN. Which is fastest for \(n=100,000\) points?
When would you use t-SNE vs PCA vs UMAP? Give specific scenarios for each.
Part 6: Model Evaluation & Practical Aspects
22 Model Evaluation Metrics
22.1 Classification Metrics
22.1.1 Confusion Matrix
Definition 22.1 (Confusion Matrix). For binary classification with classes {Positive, Negative}:
| Predicted | |||
|---|---|---|---|
| 3-4 | Positive | Negative | |
| 2-4 | Positive | TP | FN |
| 2-4 | Negative | FP | TN |
| 2-4 | |||
where:
TP (True Positive): Correctly predicted positive
TN (True Negative): Correctly predicted negative
FP (False Positive): Incorrectly predicted positive (Type I error)
FN (False Negative): Incorrectly predicted negative (Type II error)
Example 22.2 (Medical Diagnosis). Disease detection model tested on 100 patients:
| 3-4 | Predicted | ||
|---|---|---|---|
| 3-4 | Disease | Healthy | |
| 2-4 | Disease | 40 | 10 |
| 2-4 | Healthy | 5 | 45 |
| 2-4 | |||
TP=40 (correct disease detection), TN=45 (correct healthy), FP=5 (false alarm), FN=10 (missed disease).
22.1.2 Basic Metrics
Definition 22.3 (Classification Metrics). 1. Accuracy: \[\text{Accuracy} = \frac{TP + TN}{TP + TN + FP + FN}\] Proportion of correct predictions overall.
Limitation: Misleading for imbalanced datasets (e.g., 95% negative class \(\to\) predicting all negative gives 95% accuracy).
2. Precision (Positive Predictive Value): \[\text{Precision} = \frac{TP}{TP + FP}\] Of all predicted positives, what fraction are actually positive? “How precise are positive predictions?”
3. Recall (Sensitivity, True Positive Rate): \[\text{Recall} = \frac{TP}{TP + FN}\] Of all actual positives, what fraction did we detect? “How many positives did we recall?”
4. Specificity (True Negative Rate): \[\text{Specificity} = \frac{TN}{TN + FP}\] Of all actual negatives, what fraction did we correctly identify?
5. F1-Score (Harmonic Mean of Precision and Recall): \[F_1 = 2 \cdot \frac{\text{Precision} \cdot \text{Recall}}{\text{Precision} + \text{Recall}} = \frac{2TP}{2TP + FP + FN}\] Balances precision and recall. Useful when both are important.
6. F\(_\beta\)-Score (Generalized): \[F_\beta = (1 + \beta^2) \cdot \frac{\text{Precision} \cdot \text{Recall}}{\beta^2 \cdot \text{Precision} + \text{Recall}}\]
\(\beta = 1\): Equal weight (F1)
\(\beta > 1\): More weight on recall
\(\beta < 1\): More weight on precision
Precision vs Recall Trade-off:
High Precision, Low Recall:
Conservative predictions
Few false alarms (FP), but miss many positives (FN)
Example: Spam filter that rarely flags legitimate email as spam but misses some spam
High Recall, Low Precision:
Aggressive predictions
Catch most positives (low FN), but many false alarms (FP)
Example: Cancer screening that detects most cases but has many false positives
When to prioritize:
Precision: When false positives are costly (e.g., predicting customer will buy expensive item, spam detection)
Recall: When false negatives are costly (e.g., disease detection, fraud detection)
F1: When both matter equally
Example 22.4 (Computing Metrics). From medical diagnosis example (TP=40, TN=45, FP=5, FN=10): \[\begin{align} \text{Accuracy} &= \frac{40+45}{100} = 0.85 \\ \text{Precision} &= \frac{40}{40+5} = 0.889 \\ \text{Recall} &= \frac{40}{40+10} = 0.80 \\ \text{Specificity} &= \frac{45}{45+5} = 0.90 \\ F_1 &= 2 \cdot \frac{0.889 \cdot 0.80}{0.889 + 0.80} = 0.842 \end{align}\]
22.1.3 ROC Curve and AUC
Definition 22.5 (ROC Curve). The Receiver Operating Characteristic (ROC) curve plots:
X-axis: False Positive Rate (FPR) = \(\frac{FP}{FP + TN} = 1 - \text{Specificity}\)
Y-axis: True Positive Rate (TPR) = \(\frac{TP}{TP + FN} = \text{Recall}\)
at various classification thresholds.
For a classifier outputting probability \(p\), vary threshold \(t\): predict positive if \(p \geq t\).
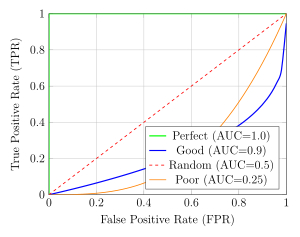
Definition 22.6 (AUC (Area Under the Curve)). AUC-ROC is the area under the ROC curve:
AUC = 1.0: Perfect classifier (100% TPR, 0% FPR)
AUC = 0.5: Random guessing (diagonal line)
AUC < 0.5: Worse than random (invert predictions!)
Interpretation: Probability that the classifier ranks a random positive example higher than a random negative example.
Advantages of ROC-AUC:
Threshold-independent: Evaluates all possible thresholds
Robust to class imbalance: Unlike accuracy
Single number summary: Easy to compare models
Probabilistic interpretation: Ranking quality
When to use ROC vs PR:
ROC: Balanced classes, care about both classes equally
PR: Imbalanced classes, focus on positive class (more informative)
22.1.4 Precision-Recall Curve
Definition 22.7 (PR Curve). Plots Precision vs Recall at various thresholds.
Better for imbalanced datasets where positive class is rare.
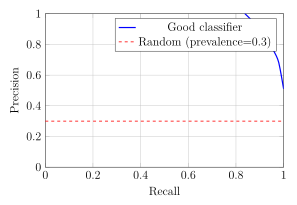
Definition 22.8 (AP and mAP). Average Precision (AP): Area under PR curve (approximation): \[AP = \sum_{k=1}^n (R_k - R_{k-1}) P_k\] where \(P_k\) and \(R_k\) are precision and recall at \(k\)-th threshold.
Mean Average Precision (mAP): Average AP across multiple classes (used in object detection).
22.1.5 Multi-Class Metrics
Definition 22.9 (Multi-Class Extension). For \(K\) classes, confusion matrix is \(K \times K\).
Macro-averaging: Compute metric for each class, then average (treats all classes equally). \[\text{Macro-F1} = \frac{1}{K}\sum_{k=1}^K F1_k\]
Micro-averaging: Pool all TP, FP, FN across classes, then compute metric (weights by class size). \[\text{Micro-Precision} = \frac{\sum_{k=1}^K TP_k}{\sum_{k=1}^K (TP_k + FP_k)}\]
Weighted-averaging: Weight each class metric by its support (number of true instances).
When to use:
Macro: When all classes are equally important (regardless of size)
Micro: When larger classes should dominate the metric
Weighted: Balance between macro and micro, considering class sizes
For imbalanced datasets, macro-averaging can reveal poor performance on minority classes that micro-averaging might hide.
22.2 Regression Metrics
Definition 22.10 (Regression Metrics). For predictions \(\hat{y}_i\) and true values \(y_i\):
1. Mean Absolute Error (MAE): \[MAE = \frac{1}{n}\sum_{i=1}^n |y_i - \hat{y}_i|\] Average absolute difference. Robust to outliers, same units as \(y\).
2. Mean Squared Error (MSE): \[MSE = \frac{1}{n}\sum_{i=1}^n (y_i - \hat{y}_i)^2\] Penalizes large errors heavily. Not in original units.
3. Root Mean Squared Error (RMSE): \[RMSE = \sqrt{MSE} = \sqrt{\frac{1}{n}\sum_{i=1}^n (y_i - \hat{y}_i)^2}\] Same scale as \(y\). More interpretable than MSE.
4. Mean Absolute Percentage Error (MAPE): \[MAPE = \frac{100\%}{n}\sum_{i=1}^n \left|\frac{y_i - \hat{y}_i}{y_i}\right|\] Scale-independent. Undefined when \(y_i = 0\).
5. R² (Coefficient of Determination): \[R^2 = 1 - \frac{SS_{\text{res}}}{SS_{\text{tot}}} = 1 - \frac{\sum_i(y_i - \hat{y}_i)^2}{\sum_i(y_i - \bar{y})^2}\] where \(\bar{y} = \frac{1}{n}\sum_i y_i\).
\(R^2 = 1\): Perfect predictions
\(R^2 = 0\): Model no better than predicting mean
\(R^2 < 0\): Model worse than mean (possible with non-linear models)
Measures proportion of variance explained by the model.
MAE vs MSE/RMSE:
MAE:
Robust to outliers
All errors weighted equally
Easier to interpret
MSE/RMSE:
Sensitive to outliers (large errors penalized heavily)
Differentiable everywhere (better for optimization)
Common in statistical theory
When outliers matter: Use MAE
When large errors are particularly bad: Use MSE/RMSE
R² advantages:
Scale-independent (compare across different problems)
Intuitive (percentage of variance explained)
R² limitations:
Always increases with more features (use adjusted R²)
Can be negative for non-linear models
Doesn’t indicate if model is appropriate
23 Model Selection and Hyperparameter Tuning
23.1 Cross-Validation
23.1.1 K-Fold Cross-Validation
Definition 23.1 (K-Fold Cross-Validation). Split data into \(K\) equal-sized folds. For each fold \(k\):
Train on folds \(\{1, \ldots, K\} \setminus \{k\}\)
Validate on fold \(k\)
Record validation metric \(M_k\)
Report average: \(\text{CV Score} = \frac{1}{K}\sum_{k=1}^K M_k\)
Common: \(K = 5\) or \(K = 10\).
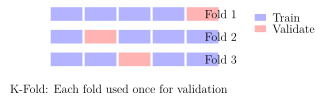
K-Fold Cross-Validation
Input: Data \(\mathcal{D}\), model/hyperparameters, \(K\)
Split \(\mathcal{D}\) into \(K\) equal-sized folds: \(\{\mathcal{D}_1, \ldots, \mathcal{D}_K\}\)
For \(k = 1\) to \(K\):
\(\mathcal{D}_{\text{train}} = \mathcal{D} \setminus \mathcal{D}_k\)
\(\mathcal{D}_{\text{val}} = \mathcal{D}_k\)
Train model on \(\mathcal{D}_{\text{train}}\)
Evaluate on \(\mathcal{D}_{\text{val}}\), record score \(M_k\)
Compute average score: \(\bar{M} = \frac{1}{K}\sum_{k=1}^K M_k\)
(Optional) Compute standard deviation: \(\sigma_M = \sqrt{\frac{1}{K}\sum_{k=1}^K (M_k - \bar{M})^2}\)
Output: Mean score \(\bar{M}\) and std \(\sigma_M\)
Why Cross-Validation?
Problem with single train/val split:
High variance (depends on random split)
Wastes data (validation set not used for training)
May not be representative
CV advantages:
Lower variance estimate
Uses all data for both training and validation
Provides confidence interval (via standard deviation)
More reliable for model selection
Choosing \(K\):
Small \(K\) (e.g., 3): Faster, higher bias, higher variance
Large \(K\) (e.g., 10): Slower, lower bias, can have higher variance
\(K = n\) (LOOCV): Maximum data per fold, very slow, high variance
Common choice: \(K = 5\) or \(10\) (good trade-off)
23.1.2 Stratified K-Fold
Definition 23.2 (Stratified K-Fold). For classification, ensure each fold has approximately the same class distribution as the full dataset.
Particularly important for:
Imbalanced datasets
Small datasets
Multi-class problems
Example 23.3 (Stratified Split). Dataset: 100 examples, 80 class A, 20 class B (80/20 split).
Regular 5-fold: Some folds might have 70/30 or 90/10 (random variation).
Stratified 5-fold: Each fold has exactly 16 class A, 4 class B (80/20 maintained).
23.1.3 Time Series Cross-Validation
Definition 23.4 (Time Series Split). For temporal data, cannot randomly shuffle (violates temporal order).
Forward chaining:
Fold 1: Train on \([1:n_1]\), validate on \([n_1+1:n_2]\)
Fold 2: Train on \([1:n_2]\), validate on \([n_2+1:n_3]\)
Fold 3: Train on \([1:n_3]\), validate on \([n_3+1:n_4]\)
...
Always train on past, predict future (no data leakage).
23.2 Hyperparameter Tuning
23.2.1 Grid Search
Definition 23.5 (Grid Search). Exhaustively search over a specified hyperparameter grid.
Example: For SVM with RBF kernel:
\(C \in \{0.1, 1, 10, 100\}\)
\(\gamma \in \{0.001, 0.01, 0.1, 1\}\)
Test all \(4 \times 4 = 16\) combinations.
Grid Search with Cross-Validation
Input: Training data \(\mathcal{D}\), model, hyperparameter grid, \(K\) for CV
Generate all combinations of hyperparameters from grid
For each combination \(\theta\):
Run \(K\)-fold CV with hyperparameters \(\theta\)
Record mean CV score \(\bar{M}(\theta)\)
Select best: \(\theta^* = \mathop{\mathrm{arg\,max}}_\theta \bar{M}(\theta)\)
Retrain final model on all data with \(\theta^*\)
Output: Best hyperparameters \(\theta^*\), trained model
Grid Search Advantages:
Simple, easy to implement
Guaranteed to find best combination in grid
Parallelizable (each combination independent)
Reproducible
Limitations:
Curse of dimensionality: \(n\) parameters with \(k\) values each \(\to\) \(k^n\) combinations
Wastes computation on unpromising regions
Grid may miss optimal values between grid points
Expensive for large grids or slow models
Best practices:
Start with coarse grid, then refine around best values
Use logarithmic spacing for parameters spanning orders of magnitude
Limit grid size (test 3-5 values per parameter max)
23.2.2 Random Search
Definition 23.6 (Random Search). Sample hyperparameter combinations randomly from specified distributions.
Instead of grid, define distributions:
\(C \sim \text{LogUniform}(10^{-3}, 10^3)\)
\(\gamma \sim \text{LogUniform}(10^{-4}, 10^1)\)
Sample \(n\) random combinations, evaluate each.
Theorem 23.7 (Random Search Efficiency). Random search is often more efficient than grid search because:
Some hyperparameters matter more than others
Random search explores more unique values for important parameters
With same budget, covers search space better
For \(n\) trials:
Grid search with 2 parameters: \(\sqrt{n} \times \sqrt{n}\) grid
Random search: \(n\) unique values per parameter
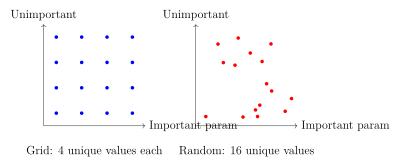
Random Search in Practice:
from sklearn.model_selection import RandomizedSearchCV
from scipy.stats import loguniform, randint

# Define distributions
param_distributions = {
    'C': loguniform(1e-3, 1e3),
    'gamma': loguniform(1e-4, 1e1),
    'kernel': ['rbf', 'poly']
}

# Random search with 100 iterations
random_search = RandomizedSearchCV(
    estimator=SVC(),
    param_distributions=param_distributions,
    n_iter=100,  # number of random samples
    cv=5,
    random_state=42,
    n_jobs=-1  # parallel
)

random_search.fit(X_train, y_train)
best_params = random_search.best_params_
23.2.3 Bayesian Optimization
Definition 23.8 (Bayesian Optimization). Intelligent search that uses past evaluations to guide future trials.
Key idea:
Build probabilistic model (surrogate) of \(f(\theta)\) where \(\theta\) are hyperparameters
Use model to select promising \(\theta\) (acquisition function)
Evaluate \(f(\theta)\), update model
Repeat
Common surrogate: Gaussian Process (GP)
Common acquisition functions:
Expected Improvement (EI): Balance exploration/exploitation
Upper Confidence Bound (UCB): \(\mu(\theta) + \kappa\sigma(\theta)\)
Bayesian Optimization vs Random/Grid:
Advantages:
Much more sample-efficient (fewer evaluations needed)
Learns from past trials
Handles expensive black-box functions well
Can incorporate prior knowledge
Disadvantages:
More complex to implement
Overhead in building surrogate model
Less parallelizable
Can get stuck in local optima
When to use:
Expensive evaluations (training takes hours)
Limited budget (can only try 10-50 configurations)
Continuous hyperparameters
Black-box optimization
Popular libraries: Optuna, Hyperopt, Scikit-Optimize, Ray Tune
23.3 Nested Cross-Validation
Definition 23.9 (Nested CV). For unbiased performance estimation with hyperparameter tuning:
Outer loop (performance estimation):
\(K_{\text{outer}}\)-fold CV
Inner loop (hyperparameter selection):
For each outer fold, run \(K_{\text{inner}}\)-fold CV on training portion
Select best hyperparameters
Evaluate on outer fold’s validation set
This prevents optimistic bias from tuning on the same data used for evaluation.
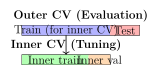
24 Data Preprocessing
24.1 Feature Scaling
24.1.1 Standardization (Z-score Normalization)
Definition 24.1 (Standardization). Transform features to have mean 0 and standard deviation 1: \[x_{\text{scaled}} = \frac{x - \mu}{\sigma}\] where \(\mu = \frac{1}{n}\sum_i x_i\) and \(\sigma = \sqrt{\frac{1}{n}\sum_i (x_i - \mu)^2}\).
Result: \(x_{\text{scaled}} \sim \mathcal{N}(0, 1)\) if original data is Gaussian.
Definition 24.2 (Min-Max Normalization). Scale features to a fixed range, typically \([0, 1]\): \[x_{\text{scaled}} = \frac{x - x_{\min}}{x_{\max} - x_{\min}}\]
For range \([a, b]\): \[x_{\text{scaled}} = a + (b - a) \cdot \frac{x - x_{\min}}{x_{\max} - x_{\min}}\]
When to use which:
Standardization:
Features have different units/scales
Many ML algorithms (SVM, logistic regression, neural networks)
When outliers should not be emphasized
Preserves outlier information (can go beyond \([0,1]\))
Min-Max:
Need bounded range (e.g., \([0,1]\))
Neural networks (especially with bounded activations like sigmoid)
Image data (pixel values)
When you want to preserve zero values
When NOT to scale:
Tree-based models (decision trees, random forests, XGBoost)—invariant to monotonic transformations
Features already on same scale
Interpretability matters (keep original units)
Critical: Fit on Training, Transform on Test
from sklearn.preprocessing import StandardScaler

# Correct way
scaler = StandardScaler()
X_train_scaled = scaler.fit_transform(X_train)
X_test_scaled = scaler.transform(X_test)  # Use training statistics

# Wrong way (data leakage!)
# scaler.fit(X_test)  # Never fit on test data!
Why? Test data should be completely unseen. Using test statistics would leak information.
24.2 Encoding Categorical Variables
24.2.1 Label Encoding
Definition 24.3 (Label Encoding). Map categories to integers: \[\text{Red} \to 0, \quad \text{Green} \to 1, \quad \text{Blue} \to 2\]
Issue: Introduces artificial ordering (\(\text{Blue} > \text{Green} > \text{Red}\)).
When to use:
Ordinal variables (Low \(<\) Medium \(<\) High)
Tree-based models (can split on integers)
Target variable in classification
24.2.2 One-Hot Encoding
Definition 24.4 (One-Hot Encoding). Create binary column for each category:
| Original | Red | Green | Blue |
|---|---|---|---|
| Red | 1 | 0 | 0 |
| Green | 0 | 1 | 0 |
| Blue | 0 | 0 | 1 |
For \(K\) categories, creates \(K\) binary features (or \(K-1\) to avoid multicollinearity).
One-Hot Advantages:
No artificial ordering
Works with linear models
Standard approach for neural networks
Limitations:
High cardinality: Many categories \(\to\) many features
Sparse matrices: Most values are 0
Curse of dimensionality: \(K\) categories = \(K\) new dimensions
Alternatives for high cardinality:
Target encoding: Replace category with mean target value
Frequency encoding: Replace with category frequency
Embedding layers: Neural network learns dense representations (NLP, RecSys)
Hashing trick: Hash categories to fixed number of buckets
24.3 Handling Missing Data
Definition 24.5 (Types of Missingness). 1. MCAR (Missing Completely At Random):
Missingness independent of observed and unobserved data
Example: Survey responses lost due to server crash
2. MAR (Missing At Random):
Missingness depends on observed data, not unobserved
Example: Older people less likely to report income (age is observed)
3. MNAR (Missing Not At Random):
Missingness depends on unobserved data
Example: High earners don’t report income (income itself causes missingness)
Definition 24.6 (Handling Strategies). 1. Deletion:
Listwise: Remove entire row if any feature missing
Pairwise: Use available data for each analysis
When: MCAR, small amount of missing data (\(<\) 5%)
2. Imputation:
Mean/Median/Mode: Simple, fast, but ignores relationships
Forward/Backward fill: For time series
KNN imputation: Use \(k\) nearest neighbors’ values
Model-based: Regression, EM algorithm, MICE
Indicator variable: Add binary flag for missingness (preserves information)
3. Model-Specific:
Some algorithms handle missing values natively (XGBoost, LightGBM)
Imputation Best Practices:
from sklearn.impute import SimpleImputer, KNNImputer

# Simple imputation
imputer = SimpleImputer(strategy='mean')  # or 'median', 'most_frequent'
X_train_imputed = imputer.fit_transform(X_train)
X_test_imputed = imputer.transform(X_test)

# KNN imputation (more sophisticated)
knn_imputer = KNNImputer(n_neighbors=5)
X_train_imputed = knn_imputer.fit_transform(X_train)Remember: Always fit imputer on training data only!
24.4 Outlier Detection and Treatment
Definition 24.7 (Outlier Detection Methods). 1. Statistical:
Z-score: \(|z| > 3\) (assuming Gaussian)
IQR method: Below \(Q_1 - 1.5 \cdot IQR\) or above \(Q_3 + 1.5 \cdot IQR\)
2. Distance-based:
DBSCAN: Points marked as noise
KNN: Points with large distance to \(k\)-th neighbor
3. Model-based:
Isolation Forest: Isolates outliers in random trees
One-Class SVM: Learns boundary around normal data
Local Outlier Factor (LOF): Compares local density
Handling Outliers:
1. Investigate first:
Data error (typo, measurement error)? → Correct or remove
Valid extreme value? → Keep (important information)
2. Treatment options:
Keep: If valid and informative
Remove: If errors or not representative
Cap/Winsorize: Replace with threshold (e.g., 95th percentile)
Transform: Log, square root to reduce impact
Separate model: Build model specifically for outliers
3. Model robustness:
Robust models: Tree-based methods, robust regression (Huber loss)
Sensitive models: Linear regression, KNN, SVM (need preprocessing)
25 Feature Engineering
25.1 Feature Extraction vs Selection
Definition 25.1 (Feature Engineering). Feature Extraction: Create new features from existing ones
PCA: Linear combinations
Polynomial features: \(x_1 \cdot x_2\), \(x_1^2\)
Domain-specific transformations
Feature Selection: Choose subset of existing features
Remove irrelevant or redundant features
Improve model performance and interpretability
Reduce overfitting and training time
25.2 Feature Selection Methods
25.2.1 Filter Methods
Definition 25.2 (Filter Methods). Select features based on statistical measures, independent of model.
1. Correlation: Remove features highly correlated with each other (redundant).
2. Mutual Information: \[MI(X, Y) = \sum_{x,y} P(x,y) \log\frac{P(x,y)}{P(x)P(y)}\] Measures dependence between feature and target (captures non-linear relationships).
3. Chi-Square Test: For categorical features and classification: \[\chi^2 = \sum_{i,j} \frac{(O_{ij} - E_{ij})^2}{E_{ij}}\] Tests independence between feature and target.
4. ANOVA F-test: For continuous features and categorical target. Tests if feature means differ across classes.
Filter Methods:
Advantages:
Fast (no model training)
Model-agnostic
Good for preprocessing
Limitations:
Ignores feature interactions
Doesn’t consider model performance
May select redundant features
25.2.2 Wrapper Methods
Definition 25.3 (Wrapper Methods). Use model performance to guide feature selection.
1. Forward Selection:
Start with no features
Add one feature at a time (choose best improvement)
Stop when no improvement
2. Backward Elimination:
Start with all features
Remove one feature at a time (remove worst)
Stop when removal hurts performance
3. Recursive Feature Elimination (RFE):
Train model on all features
Rank features by importance
Remove least important
Repeat until desired number of features
Recursive Feature Elimination (RFE)
Input: Features \(\boldsymbol{X}\), target \(\boldsymbol{y}\), model, target feature count \(k\)
Initialize: Current feature set \(\mathcal{F} = \{\text{all features}\}\)
While \(|\mathcal{F}| > k\):
Train model on features in \(\mathcal{F}\)
Compute feature importances (e.g., coefficients, Gini importance)
Remove feature with lowest importance from \(\mathcal{F}\)
Output: Selected features \(\mathcal{F}\)
Wrapper Methods:
Advantages:
Considers model performance directly
Can capture feature interactions
Optimizes for specific model
Limitations:
Computationally expensive (many model trainings)
Risk of overfitting (especially with small data)
Model-specific (selected features may not work for other models)
25.2.3 Embedded Methods
Definition 25.4 (Embedded Methods). Feature selection built into model training.
1. L1 Regularization (Lasso): Penalty \(\lambda\sum_j |w_j|\) drives some weights to exactly zero.
2. Tree-based Feature Importance: Random Forest, XGBoost provide importance scores. Select top \(k\) features.
3. ElasticNet: Combines L1 (sparsity) and L2 (grouping) penalties.
Embedded Methods:
Advantages:
Faster than wrapper methods
Less overfitting risk
Integrated with training
Best Practice:
Start with filter methods (fast preprocessing)
Use embedded methods if model supports (L1, tree importance)
Use wrapper methods for critical applications with budget
25.3 Domain-Specific Feature Engineering
Example 25.5 (Common Transformations). 1. Time Features (from datetime):
Hour, day of week, month, year
Is weekend? Is holiday?
Time since event
Cyclic encoding: \(\sin(2\pi \cdot \text{hour}/24)\), \(\cos(2\pi \cdot \text{hour}/24)\)
2. Text Features:
Bag of words, TF-IDF
N-grams
Length, number of words, capitals
Sentiment scores
Word embeddings (Word2Vec, GloVe)
3. Geospatial:
Distance to landmark
Cluster of locations
Urban vs rural classification
4. Interaction Features:
Products: \(x_1 \cdot x_2\)
Ratios: \(x_1 / x_2\)
Differences: \(x_1 - x_2\)
5. Aggregations (for grouped data):
Mean, median, std per group
Count, min, max per group
Time-based: rolling averages, lag features
25.4 Summary of Part 6
Classification Metrics: Confusion matrix, precision, recall, F1. ROC-AUC for balanced data, PR curve for imbalanced. Choose metric based on cost of errors.
Regression Metrics: MAE (robust to outliers), RMSE (penalizes large errors), R² (variance explained). Choose based on error characteristics.
Cross-Validation: K-fold for robust evaluation. Stratified for classification. Time series split for temporal data. Nested CV for hyperparameter tuning.
Hyperparameter Tuning: Grid search (exhaustive), random search (efficient), Bayesian optimization (sample-efficient for expensive evaluations).
Feature Scaling: Standardization (most ML algorithms), Min-Max (bounded activations). Always fit on training, transform on test.
Categorical Encoding: Label for ordinal, one-hot for nominal. Target encoding for high cardinality.
Missing Data: Understand missingness type (MCAR/MAR/MNAR). Imputation strategies from simple (mean) to complex (KNN, model-based).
Feature Selection: Filter (fast, model-agnostic), wrapper (model-specific, expensive), embedded (integrated). Use based on computational budget and goals.
Next Steps: Part 7 covers practical tools and deployment: WEKA, scikit-learn pipelines, and model serving strategies.
Exercise 25.6.
Given confusion matrix with TP=85, TN=40, FP=10, FN=15, compute accuracy, precision, recall, F1, and specificity.
Explain why accuracy is misleading for a dataset with 95% negative class, 5% positive class. What metrics would you use instead?
For a cancer detection model, would you prioritize precision or recall? Justify your answer and suggest an appropriate threshold strategy.
Implement 5-fold cross-validation by hand for a dataset with 100 examples. Show which examples go in which fold.
Why must we fit the scaler on training data only? What happens if we fit on all data (train + test)?
Design one-hot encoding for categorical variable {Red, Green, Blue, Red, Green}. How many columns? Should you use \(K\) or \(K-1\) columns?
Compare computational complexity: Grid search with 4 parameters (5 values each) vs random search with 100 iterations. Which tries more unique combinations for each parameter?
For time series data, why can’t we use regular k-fold cross-validation? Design a proper time series CV scheme for 120 monthly observations.
Part 7: Tools, Pipelines, and Deployment
26 WEKA: Practical Guide
26.1 Introduction to WEKA
Definition 26.1 (WEKA). WEKA (Waikato Environment for Knowledge Analysis) is a collection of machine learning algorithms for data mining tasks. Developed at University of Waikato, New Zealand.
Key Features:
GUI-based interface (no coding required)
Extensive algorithm library (classification, regression, clustering, etc.)
Built-in visualization tools
Java-based (cross-platform)
Free and open-source
When to use WEKA:
Quick prototyping and experimentation
Teaching and learning ML concepts
Comparing multiple algorithms easily
Small to medium datasets
When GUI is preferred over coding
26.2 WEKA Explorer Interface
WEKA Explorer has 6 main tabs:
1. Preprocess: Load data, view statistics, apply filters
Import ARFF, CSV, JDBC databases
View attribute statistics and distributions
Apply filters (discretization, normalization, attribute selection)
2. Classify: Train classification/regression models
Choose algorithm from tree structure
Configure hyperparameters
Select test options (cross-validation, percentage split, etc.)
View results: accuracy, confusion matrix, ROC
3. Cluster: Perform clustering
K-means, EM, DBSCAN, hierarchical
Evaluate clusters
Visualize assignments
4. Associate: Find association rules
Apriori, FP-Growth
Set minimum support and confidence
5. Select attributes: Feature selection
Various search and evaluation methods
Rank features by importance
6. Visualize: Data exploration
Scatter plots, histograms
Class distributions
Interactive exploration
26.3 Data Format: ARFF
Definition 26.2 (ARFF Format). ARFF (Attribute-Relation File Format) is WEKA’s native format.
Structure:
@relation weather

@attribute outlook {sunny, overcast, rainy}
@attribute temperature numeric
@attribute humidity numeric
@attribute windy {TRUE, FALSE}
@attribute play {yes, no}

@data
sunny,85,85,FALSE,no
sunny,80,90,TRUE,no
overcast,83,86,FALSE,yes
rainy,70,96,FALSE,yes
...Components:
@relation: Dataset name@attribute: Feature name and type (numeric, nominal, string, date)@data: Actual data rows
26.4 Workflow Example: Classification
WEKA Classification Workflow
Step 1: Load Data
Open Explorer \(\to\) Preprocess tab
Click “Open file...” \(\to\) Select ARFF or CSV
Review attributes in the table
Check class distribution (click on class attribute)
Step 2: Preprocess (Optional)
Apply filters: Click “Choose” under Filter
Example:
unsupervised.attribute.Normalizefor scalingClick “Apply” to execute filter
Step 3: Select Algorithm
Click “Classify” tab
Click “Choose” button
Navigate tree: e.g.,
trees\(\to\)J48(decision tree)Click on algorithm name to configure parameters
Step 4: Choose Test Method
Cross-validation: Select folds (default 10)
Percentage split: e.g., 66% train, 34% test
Use training set: Evaluate on training (overfitting check)
Supplied test set: Load separate test file
Step 5: Run and Evaluate
Click “Start” button
View results in output area:
Summary statistics
Confusion matrix
Detailed accuracy by class
Right-click on result \(\to\) Visualize for plots
Step 6: Compare Models
Run multiple algorithms (results stack in result list)
Right-click result list \(\to\) Compare to compare
Export results: Right-click \(\to\) Save result buffer
26.5 Common WEKA Algorithms
| Category | Algorithms in WEKA |
|---|---|
| Trees | J48 (C4.5), RandomForest, REPTree |
| Rules | JRip, PART, DecisionTable |
| Functions | Logistic, MultilayerPerceptron, SMO (SVM) |
| Lazy | IBk (KNN), LWL |
| Bayes | NaiveBayes, BayesNet |
| Meta | AdaBoostM1, Bagging, Stacking, Vote |
| Clustering | SimpleKMeans, EM, DBSCAN, HierarchicalClusterer |
26.6 Visualizing Results
WEKA Visualization Tools:
1. ROC Curve:
After classification: Right-click result \(\to\) Visualize threshold curve
Choose class and metric (TPR vs FPR for ROC)
Compare multiple classifiers on same plot
2. Classification Errors:
Right-click result \(\to\) Visualize classifier errors
Shows 2D plot of predictions
Misclassified instances highlighted
Interactive: hover for details
3. Tree Visualization:
After training tree (J48, RandomForest): Right-click \(\to\) Visualize tree
Shows decision rules graphically
Can save as PNG/PDF
4. Cost/Benefit Analysis:
Define cost matrix for different types of errors
WEKA computes expected cost
Useful for imbalanced datasets
26.7 Advantages and Limitations
WEKA Advantages:
Easy to use: GUI-based, no programming required
Comprehensive: 100+ algorithms built-in
Educational: Excellent for learning ML
Visualization: Good built-in plots
Reproducible: Can save configurations
WEKA Limitations:
Not for production: GUI-based, not suitable for deployment
Scalability: Limited to datasets that fit in memory
Modern algorithms: Lacks latest methods (no XGBoost, deep learning)
Automation: Difficult to automate workflows
Customization: Limited compared to programming libraries
Best Use Cases:
Academic research and teaching
Quick baseline comparisons
Data exploration
Proof of concept
When to move beyond WEKA:
Large-scale datasets (\(>\)1M rows)
Production deployment
Need for latest algorithms
Complex preprocessing pipelines
Integration with other systems
27 ML Pipelines in Python
27.1 Introduction to Scikit-learn
Definition 27.1 (Scikit-learn). Scikit-learn is Python’s premier machine learning library, offering:
Consistent API across algorithms
Comprehensive algorithm coverage
Excellent documentation
Integration with NumPy, Pandas, Matplotlib
Production-ready code
Core API: All estimators follow the same pattern:
model = Estimator()          # Initialize
model.fit(X_train, y_train)  # Train
predictions = model.predict(X_test)  # Predict
score = model.score(X_test, y_test)  # Evaluate
27.2 The Pipeline Concept
Definition 27.2 (Pipeline). A Pipeline chains multiple processing steps into a single estimator: \[\text{Data} \xrightarrow{\text{Transform 1}} \xrightarrow{\text{Transform 2}} \xrightarrow{\cdots} \xrightarrow{\text{Model}}\]
Benefits:
Convenience: Single
fit()/predict()callPrevents leakage: Transformers fit only on training data
Hyperparameter tuning: Tune entire pipeline with GridSearchCV
Reproducibility: Easy to save and load entire workflow
Code cleanliness: Organized preprocessing + modeling
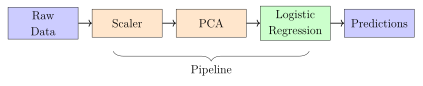
27.3 Building Pipelines
Basic Pipeline Example:
from sklearn.pipeline import Pipeline
from sklearn.preprocessing import StandardScaler
from sklearn.decomposition import PCA
from sklearn.linear_model import LogisticRegression

# Create pipeline
pipeline = Pipeline([
    ('scaler', StandardScaler()),      # Step 1: Scale
    ('pca', PCA(n_components=10)),     # Step 2: Reduce dim
    ('classifier', LogisticRegression()) # Step 3: Classify
])

# Use like any other estimator
pipeline.fit(X_train, y_train)
predictions = pipeline.predict(X_test)
accuracy = pipeline.score(X_test, y_test)

print(f"Accuracy: {accuracy:.3f}")
Key Points:
Each step is a tuple:
(’name’, transformer)All steps except last must have
fit_transform()Last step must have
fit()andpredict()Access steps:
pipeline.named_steps[’scaler’]
27.4 Column Transformer
Definition 27.3 (ColumnTransformer). Apply different transformations to different columns:
from sklearn.compose import ColumnTransformer
from sklearn.preprocessing import StandardScaler, OneHotEncoder

# Define transformations for different column types
preprocessor = ColumnTransformer([
    ('num', StandardScaler(), ['age', 'income']),
    ('cat', OneHotEncoder(), ['gender', 'city'])
])

# Use in pipeline
pipeline = Pipeline([
    ('preprocessor', preprocessor),
    ('classifier', RandomForestClassifier())
])Benefits:
Handle mixed data types (numerical + categorical)
Apply appropriate transformation to each feature type
Cleaner than manual column splitting
27.5 Pipeline with GridSearchCV
Hyperparameter Tuning with Pipeline:
from sklearn.model_selection import GridSearchCV

# Create pipeline
pipeline = Pipeline([
    ('scaler', StandardScaler()),
    ('classifier', SVC())
])

# Define parameter grid (use double underscore)
param_grid = {
    'classifier__C': [0.1, 1, 10],
    'classifier__gamma': [0.001, 0.01, 0.1],
    'classifier__kernel': ['rbf', 'linear']
}

# Grid search on entire pipeline
grid_search = GridSearchCV(
    pipeline,
    param_grid,
    cv=5,
    scoring='accuracy',
    n_jobs=-1
)

grid_search.fit(X_train, y_train)

print(f"Best params: {grid_search.best_params_}")
print(f"Best CV score: {grid_search.best_score_:.3f}")

# Use best model
best_model = grid_search.best_estimator_
test_score = best_model.score(X_test, y_test)
Naming convention: Use step_name__parameter_name to reference pipeline parameters.
27.6 Custom Transformers
Definition 27.4 (Custom Transformer). Create your own transformer by inheriting from BaseEstimator and TransformerMixin:
from sklearn.base import BaseEstimator, TransformerMixin

class LogTransformer(BaseEstimator, TransformerMixin):
    def __init__(self, features):
        self.features = features

    def fit(self, X, y=None):
        return self  # Nothing to learn

    def transform(self, X):
        X_copy = X.copy()
        X_copy[self.features] = np.log1p(X_copy[self.features])
        return X_copy

# Use in pipeline
pipeline = Pipeline([
    ('log', LogTransformer(['income', 'age'])),
    ('scaler', StandardScaler()),
    ('model', RandomForestRegressor())
])Requirements:
Implement
fit()(even if it just returnsself)Implement
transform()Optionally implement
fit_transform()(inherited from mixin)
27.7 Model Persistence
27.7.1 Saving and Loading Models
Method 1: Joblib (Recommended):
import joblib

# Save model
joblib.dump(pipeline, 'model_pipeline.joblib')

# Load model
loaded_pipeline = joblib.load('model_pipeline.joblib')

# Use loaded model
predictions = loaded_pipeline.predict(X_new)
Method 2: Pickle:
import pickle

# Save
with open('model.pkl', 'wb') as f:
    pickle.dump(pipeline, f)

# Load
with open('model.pkl', 'rb') as f:
    loaded_model = pickle.load(f)
Joblib vs Pickle:
Joblib: Better for large NumPy arrays (efficient compression)
Pickle: More general, works with any Python object
Both are not cross-version compatible (save scikit-learn version!)
27.7.2 Versioning and Reproducibility
Best Practices for Model Persistence:
1. Save Metadata:
import json
from datetime import datetime

metadata = {
    'model_type': 'RandomForestClassifier',
    'sklearn_version': sklearn.__version__,
    'training_date': datetime.now().isoformat(),
    'features': list(X_train.columns),
    'performance': {
        'train_accuracy': train_acc,
        'test_accuracy': test_acc,
        'cv_score': cv_score
    },
    'hyperparameters': grid_search.best_params_
}

with open('model_metadata.json', 'w') as f:
    json.dump(metadata, f, indent=2)
2. Version Control:
Use Git for code
Use DVC (Data Version Control) for models and data
Tag model versions:
v1.0.0,v1.1.0
3. Environment Management:
# Save environment
pip freeze > requirements.txt

# Or use conda
conda env export > environment.yml
4. Directory Structure: 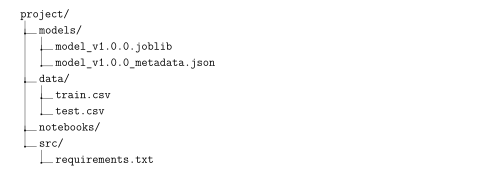
27.8 Complete Pipeline Example
End-to-End Pipeline with All Features:
from sklearn.pipeline import Pipeline
from sklearn.compose import ColumnTransformer
from sklearn.preprocessing import StandardScaler, OneHotEncoder
from sklearn.impute import SimpleImputer
from sklearn.ensemble import RandomForestClassifier
from sklearn.model_selection import cross_val_score
import pandas as pd
import joblib

# Define column types
numeric_features = ['age', 'income', 'credit_score']
categorical_features = ['gender', 'education', 'employment']

# Numeric pipeline
numeric_transformer = Pipeline([
    ('imputer', SimpleImputer(strategy='median')),
    ('scaler', StandardScaler())
])

# Categorical pipeline
categorical_transformer = Pipeline([
    ('imputer', SimpleImputer(strategy='most_frequent')),
    ('onehot', OneHotEncoder(handle_unknown='ignore'))
])

# Combine with ColumnTransformer
preprocessor = ColumnTransformer([
    ('num', numeric_transformer, numeric_features),
    ('cat', categorical_transformer, categorical_features)
])

# Full pipeline
pipeline = Pipeline([
    ('preprocessor', preprocessor),
    ('classifier', RandomForestClassifier(random_state=42))
])

# Cross-validation
cv_scores = cross_val_score(
    pipeline, X_train, y_train,
    cv=5, scoring='accuracy'
)
print(f"CV Accuracy: {cv_scores.mean():.3f} (+/- {cv_scores.std():.3f})")

# Train final model
pipeline.fit(X_train, y_train)

# Evaluate
test_score = pipeline.score(X_test, y_test)
print(f"Test Accuracy: {test_score:.3f}")

# Save
joblib.dump(pipeline, 'credit_model_pipeline.joblib')

# Later: Load and predict
loaded_pipeline = joblib.load('credit_model_pipeline.joblib')
new_predictions = loaded_pipeline.predict(X_new)
28 Model Deployment
28.1 Deployment Considerations
Key Questions Before Deployment:
1. Latency Requirements:
Real-time (\(<\) 100ms): Lightweight models, caching
Near real-time (seconds): Most models acceptable
Batch processing (hours): Any model size
2. Scale:
Queries per second (QPS)?
Peak vs average load?
Need for horizontal scaling?
3. Infrastructure:
Cloud (AWS, GCP, Azure) vs on-premise?
Serverless (Lambda) vs containers (Docker) vs VMs?
GPU required?
4. Monitoring:
Performance metrics (latency, throughput)
Model metrics (accuracy, drift detection)
System metrics (CPU, memory, errors)
5. Updates:
How often to retrain?
Blue-green deployment vs canary?
Rollback strategy?
28.2 Model Export Formats
28.2.1 ONNX (Open Neural Network Exchange)
Definition 28.1 (ONNX). ONNX is an open format for representing ML models, enabling interoperability across frameworks.
Benefits:
Train in one framework (PyTorch, scikit-learn), deploy in another
Optimized inference engines (ONNX Runtime)
Hardware acceleration support
Language-agnostic (use from Python, C++, Java, etc.)
# Convert scikit-learn to ONNX
from skl2onnx import convert_sklearn
from skl2onnx.common.data_types import FloatTensorType

# Define input type
initial_type = [('float_input', FloatTensorType([None, n_features]))]

# Convert
onnx_model = convert_sklearn(
    sklearn_model,
    initial_types=initial_type
)

# Save
with open("model.onnx", "wb") as f:
    f.write(onnx_model.SerializeToString())

# Load and inference with ONNX Runtime
import onnxruntime as rt

sess = rt.InferenceSession("model.onnx")
input_name = sess.get_inputs()[0].name
pred = sess.run(None, {input_name: X_test.astype(np.float32)})
28.2.2 TensorFlow SavedModel
Definition 28.2 (TensorFlow SavedModel). TensorFlow’s universal format for saving models.
import tensorflow as tf

# Save
model.save('saved_model/my_model')

# Load
loaded_model = tf.keras.models.load_model('saved_model/my_model')

# Predict
predictions = loaded_model.predict(X_test)Benefits:
Complete model serialization (architecture + weights + config)
TensorFlow Serving integration
TensorFlow Lite for mobile/edge
28.2.3 Format Comparison
| Format | Framework | Use Case | Pros |
|---|---|---|---|
| Pickle/Joblib | Any Python | Python-only | Simple, native |
| ONNX | Cross-framework | Production | Optimized, portable |
| SavedModel | TensorFlow | TF ecosystem | Complete, TF Serving |
| PMML | Traditional ML | Enterprise | Standardized, legacy |
28.3 Serving Models via REST API
28.3.1 Flask API
Simple Flask API for Model Serving:
from flask import Flask, request, jsonify
import joblib
import numpy as np

# Initialize Flask app
app = Flask(__name__)

# Load model at startup
model = joblib.load('model_pipeline.joblib')

@app.route('/predict', methods=['POST'])
def predict():
    try:
        # Get JSON data
        data = request.get_json()

        # Convert to array
        features = np.array(data['features']).reshape(1, -1)

        # Predict
        prediction = model.predict(features)
        probability = model.predict_proba(features)

        # Return response
        return jsonify({
            'prediction': int(prediction[0]),
            'probability': probability[0].tolist(),
            'status': 'success'
        })

    except Exception as e:
        return jsonify({
            'error': str(e),
            'status': 'error'
        }), 400

@app.route('/health', methods=['GET'])
def health():
    return jsonify({'status': 'healthy'})

if __name__ == '__main__':
    app.run(host='0.0.0.0', port=5000)
Test with curl:
curl -X POST http://localhost:5000/predict \
  -H "Content-Type: application/json" \
  -d '{"features": [25, 50000, 700, 1, 2]}'
28.3.2 FastAPI (Modern Alternative)
FastAPI for High-Performance Serving:
from fastapi import FastAPI, HTTPException
from pydantic import BaseModel
import joblib
import numpy as np

# Define input schema
class PredictionRequest(BaseModel):
    features: list[float]

class PredictionResponse(BaseModel):
    prediction: int
    probability: list[float]

# Initialize app
app = FastAPI(title="ML Model API")

# Load model
model = joblib.load('model_pipeline.joblib')

@app.post("/predict", response_model=PredictionResponse)
async def predict(request: PredictionRequest):
    try:
        features = np.array(request.features).reshape(1, -1)
        prediction = model.predict(features)
        probability = model.predict_proba(features)

        return PredictionResponse(
            prediction=int(prediction[0]),
            probability=probability[0].tolist()
        )
    except Exception as e:
        raise HTTPException(status_code=400, detail=str(e))

@app.get("/health")
async def health():
    return {"status": "healthy"}

# Run with: uvicorn main:app --reload
FastAPI Advantages:
Automatic API documentation (Swagger UI at
/docs)Type validation with Pydantic
Async support (higher throughput)
Modern, faster than Flask
28.4 Containerization with Docker
Dockerfile for ML API:
FROM python:3.9-slim

WORKDIR /app

# Copy requirements and install
COPY requirements.txt .
RUN pip install --no-cache-dir -r requirements.txt

# Copy model and code
COPY model_pipeline.joblib .
COPY app.py .

# Expose port
EXPOSE 5000

# Run app
CMD ["python", "app.py"]
Build and Run:
# Build image
docker build -t ml-model-api .

# Run container
docker run -p 5000:5000 ml-model-api

# Test
curl http://localhost:5000/health
Docker Compose for Multi-Service:
version: '3.8'

services:
  api:
    build: .
    ports:
      - "5000:5000"
    environment:
      - MODEL_PATH=/models/model.joblib
    volumes:
      - ./models:/models

  redis:
    image: redis:alpine
    ports:
      - "6379:6379"
28.5 Cloud Deployment
Cloud Deployment Options:
1. Serverless (AWS Lambda, Google Cloud Functions):
Pros: No server management, auto-scaling, pay per use
Cons: Cold starts, limited execution time, limited memory
Best for: Low to medium traffic, event-driven, cost-sensitive
2. Containers (AWS ECS, GKE, Azure Container Instances):
Pros: Consistent environments, easy scaling, orchestration
Cons: More complex setup, need to manage infrastructure
Best for: Medium to high traffic, microservices
3. Managed ML Services:
AWS SageMaker, Google AI Platform, Azure ML
Pros: Built-in monitoring, auto-scaling, A/B testing, versioning
Cons: Vendor lock-in, can be expensive
Best for: Enterprise ML, need full MLOps
4. Kubernetes:
Pros: Highly scalable, flexible, cloud-agnostic
Cons: Steep learning curve, operational overhead
Best for: Large scale, multi-model serving, complex workflows
28.6 Model Monitoring
Definition 28.3 (Model Monitoring). Continuous tracking of model performance and data quality in production.
Key Metrics to Monitor:
1. Performance Metrics:
Prediction accuracy/error
Latency (p50, p95, p99)
Throughput (requests per second)
2. Data Quality:
Missing values
Out-of-range values
Data type mismatches
3. Data Drift:
Feature distribution changes
Target distribution changes
KL divergence, KS test
4. Concept Drift:
\(P(y|X)\) changes over time
Model accuracy degrades
Need retraining
5. System Metrics:
CPU/memory usage
Error rates
Uptime
Simple Logging for Monitoring:
import logging
import time
from datetime import datetime

# Setup logging
logging.basicConfig(level=logging.INFO)
logger = logging.getLogger(__name__)

@app.route('/predict', methods=['POST'])
def predict():
    start_time = time.time()

    try:
        data = request.get_json()
        features = np.array(data['features']).reshape(1, -1)

        # Predict
        prediction = model.predict(features)
        probability = model.predict_proba(features)

        # Log prediction
        latency = time.time() - start_time
        logger.info({
            'timestamp': datetime.now().isoformat(),
            'features': features.tolist(),
            'prediction': int(prediction[0]),
            'confidence': float(probability[0].max()),
            'latency_ms': latency * 1000
        })

        return jsonify({
            'prediction': int(prediction[0]),
            'probability': probability[0].tolist()
        })

    except Exception as e:
        logger.error(f"Prediction error: {str(e)}")
return jsonify({'error': str(e)}), 400Advanced: Use dedicated tools like Prometheus, Grafana, ELK stack, or cloud-native solutions (CloudWatch, Stackdriver).
28.7 Best Practices Summary
Versioning: Tag models, save metadata, track lineage
Testing: Unit tests, integration tests, load tests before production
Monitoring: Log predictions, track performance, detect drift
Gradual Rollout: Canary deployment (5% \(\to\) 50% \(\to\) 100%)
Rollback Plan: Keep previous model version, quick rollback capability
Security:
API authentication (API keys, OAuth)
Rate limiting
Input validation
HTTPS only
Documentation: API docs, model cards, usage examples
Automation: CI/CD pipeline for model updates
Cost Optimization: Right-size resources, use caching, batch predictions when possible
Feedback Loop: Collect ground truth labels, retrain periodically
28.8 Summary of Part 7
WEKA: GUI-based tool excellent for learning and quick experiments. Good for prototyping but not production. Easy algorithm comparison.
Scikit-learn Pipelines: Chain preprocessing and modeling. Prevents data leakage, enables hyperparameter tuning on entire workflow. Use ColumnTransformer for mixed data types.
Model Persistence: Use joblib for scikit-learn models. Save metadata (version, hyperparameters, performance). Version control models.
Export Formats: ONNX for cross-framework compatibility, SavedModel for TensorFlow ecosystem, pickle/joblib for Python-only.
API Serving: Flask for simple APIs, FastAPI for high performance. Include health checks and error handling.
Containerization: Docker ensures consistent environments. Docker Compose for multi-service setups.
Cloud Deployment: Choose based on scale (serverless \(\to\) containers \(\to\) Kubernetes). Managed services for full MLOps.
Monitoring: Track performance, data drift, system metrics. Log predictions for debugging and retraining.
Next Steps: Part 8 covers advanced topics: reinforcement learning, representation learning, ethics in ML, and modern trends like foundation models and AutoML.
Exercise 28.4.
Design a WEKA workflow to compare Decision Tree (J48), Random Forest, and SVM on the Iris dataset. What test method would you use and why?
Create a scikit-learn pipeline that handles both numeric (scaling) and categorical (one-hot encoding) features, then trains a Random Forest. Include proper error handling.
Explain why we must fit transformers only on training data. Give an example of what goes wrong if we fit on test data.
Design a Flask API that serves a sentiment analysis model. Include endpoints for single prediction and batch prediction. Add appropriate error handling.
Write a Dockerfile for deploying a scikit-learn model as a Flask API. What base image would you use? Why?
Compare serverless (AWS Lambda) vs container (Docker on ECS) deployment for: (a) Low-traffic app (100 requests/day), (b) High-traffic app (10,000 requests/second).
Design a monitoring system for a production model. What metrics would you track? How would you detect when the model needs retraining?
Implement a simple A/B test framework where 10% of traffic goes to a new model version, 90% to the old version. How would you decide when to fully switch?
Part 8: Advanced Topics and Modern Directions
29 Reinforcement Learning
29.1 Introduction to Reinforcement Learning
Definition 29.1 (Reinforcement Learning). Reinforcement Learning (RL) is learning by interacting with an environment to maximize cumulative reward.
Key difference from supervised learning:
No labeled examples—agent must discover good actions through trial and error
Delayed rewards—actions may have long-term consequences
Sequential decision-making—current action affects future states
29.2 Core Components
Definition 29.2 (RL Framework). An RL system consists of:
1. Agent: The learner/decision maker
2. Environment: Everything the agent interacts with
3. State (\(s_t\)): Current situation of the agent
4. Action (\(a_t\)): Choice made by the agent
5. Reward (\(r_t\)): Immediate feedback from environment
6. Policy (\(\pi\)): Agent’s strategy for selecting actions \[\pi(a|s) = P(\text{action } a | \text{state } s)\]
7. Value Function (\(V^\pi(s)\)): Expected cumulative reward from state \(s\) under policy \(\pi\) \[V^\pi(s) = \mathbb{E}_\pi\left[\sum_{t=0}^\infty \gamma^t r_t \mid s_0 = s\right]\] where \(\gamma \in [0, 1]\) is the discount factor.
8. Q-Function (\(Q^\pi(s,a)\)): Expected cumulative reward from taking action \(a\) in state \(s\) \[Q^\pi(s,a) = \mathbb{E}_\pi\left[\sum_{t=0}^\infty \gamma^t r_t \mid s_0 = s, a_0 = a\right]\]
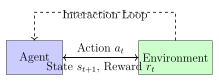
Intuition 256. Think of learning to play a video game:
State: Current game screen
Action: Button presses (up, down, left, right, jump)
Reward: Points gained, lives lost
Policy: Strategy for playing (e.g., “when enemy approaches, jump”)
Goal: Maximize total score (cumulative reward)
The agent explores different actions, observes rewards, and learns which actions lead to high scores.
29.3 The Exploration-Exploitation Dilemma
Definition 29.4 (Exploration vs Exploitation). Exploitation: Choose the best-known action (maximize immediate reward)
Exploration: Try new actions to discover potentially better options
Dilemma: How to balance?
Pure exploitation: May miss better strategies
Pure exploration: Wastes time on known bad actions
\(\epsilon\)-Greedy Strategy: \[a_t = \begin{cases} \mathop{\mathrm{arg\,max}}_a Q(s_t, a) & \text{with probability } 1-\epsilon \text{ (exploit)} \\ \text{random action} & \text{with probability } \epsilon \text{ (explore)} \end{cases}\] Common: Start with high \(\epsilon\) (e.g., 1.0), decay over time to 0.01.
29.4 Q-Learning
Definition 29.5 (Q-Learning). Model-free algorithm to learn optimal Q-function (and thus optimal policy).
Bellman Optimality Equation: \[Q^*(s,a) = \mathbb{E}_{s' \sim P(\cdot|s,a)}\left[r(s,a) + \gamma \max_{a'} Q^*(s', a')\right]\] The optimal Q-value equals expected immediate reward plus discounted max future Q-value. In deterministic environments, this simplifies to \(Q^*(s,a) = r + \gamma \max_{a'} Q^*(s', a')\).
Q-Learning Update Rule: \[Q(s_t, a_t) \leftarrow Q(s_t, a_t) + \alpha\left[r_t + \gamma \max_{a} Q(s_{t+1}, a) - Q(s_t, a_t)\right]\] where \(\alpha\) is the learning rate.
Intuition: Adjust Q-value toward the observed return (TD error).
Q-Learning Algorithm
Initialize: Q-table \(Q(s,a) = 0\) for all states \(s\) and actions \(a\)
For each episode:
Initialize state \(s\)
While not terminal:
Choose action \(a\) using \(\epsilon\)-greedy policy based on \(Q(s, \cdot)\)
Take action \(a\), observe reward \(r\) and next state \(s'\)
Update: \[Q(s,a) \leftarrow Q(s,a) + \alpha\left[r + \gamma \max_{a'} Q(s',a') - Q(s,a)\right]\]
\(s \leftarrow s'\)
Output: Learned Q-table, optimal policy \(\pi^*(s) = \mathop{\mathrm{arg\,max}}_a Q(s,a)\)
Example 29.6 (GridWorld Navigation). Agent in \(4 \times 4\) grid, goal at top-right corner.
States: Grid positions Actions: \(\{\text{up, down, left, right}\}\) Rewards: \(-1\) per step, \(+10\) at goal, \(-10\) for obstacles
Q-learning discovers shortest path by learning Q-values for each (state, action) pair.
29.5 Deep Q-Networks (DQN)
Definition 29.7 (DQN). Extend Q-learning to high-dimensional state spaces (e.g., images) using neural networks.
Instead of Q-table, use neural network \(Q(s, a; \theta)\) parameterized by \(\theta\).
Key innovations:
1. Experience Replay:
Store transitions \((s_t, a_t, r_t, s_{t+1})\) in replay buffer
Sample random mini-batches for training
Breaks correlation between consecutive samples
2. Target Network:
Use separate network \(Q(s, a; \theta^-)\) for target computation
Update \(\theta^-\) periodically (copy from \(\theta\))
Stabilizes training (target doesn’t move every update)
Loss Function: \[\mathcal{L}(\theta) = \mathbb{E}_{(s,a,r,s') \sim \text{Buffer}}\left[\left(r + \gamma \max_{a'} Q(s', a'; \theta^-) - Q(s, a; \theta)\right)^2\right]\]
DQN Breakthroughs:
Success: DQN (2013-2015) achieved human-level performance on Atari games using only pixel input.
Why important:
First deep RL success on complex tasks
Showed RL can work with raw sensory input
Sparked modern deep RL research
Extensions:
Double DQN: Addresses overestimation bias
Dueling DQN: Separate value and advantage streams
Prioritized Experience Replay: Sample important transitions more
Rainbow: Combines multiple improvements
Limitations:
Sample inefficient (needs millions of frames)
Discrete actions only
Can be unstable
29.6 Policy Gradient Methods
Definition 29.8 (Policy Gradient). Instead of learning Q-function, directly learn policy \(\pi(a|s; \theta)\).
Objective: Maximize expected cumulative reward \[J(\theta) = \mathbb{E}_{\tau \sim \pi_\theta}\left[\sum_t r_t\right]\]
Policy Gradient Theorem: \[\nabla_\theta J(\theta) = \mathbb{E}_{\tau \sim \pi_\theta}\left[\sum_t \nabla_\theta \log \pi_\theta(a_t|s_t) \cdot G_t\right]\] where \(G_t = \sum_{k=t}^\infty \gamma^{k-t} r_k\) is return from time \(t\).
Intuition: Increase probability of actions that led to high returns.
Modern Algorithms:
REINFORCE: Basic policy gradient
Actor-Critic: Combines policy gradient with value function
A3C: Asynchronous actor-critic
PPO (Proximal Policy Optimization): State-of-the-art, stable
SAC (Soft Actor-Critic): Maximum entropy RL
29.7 Applications of RL
Game Playing: AlphaGo, OpenAI Five (Dota 2), AlphaStar (StarCraft)
Robotics: Manipulation, locomotion, drone control
Autonomous Vehicles: Path planning, decision making
Recommendation Systems: Sequential recommendations
Resource Management: Data center cooling, traffic light control
Finance: Trading, portfolio management
Healthcare: Treatment optimization, drug dosing
30 Representation Learning
30.1 Introduction to Representation Learning
Definition 30.1 (Representation Learning). Learning good representations (features) of data automatically, rather than hand-crafting them.
Goal: Discover abstractions that make it easier to extract useful information for downstream tasks.
Good representations:
Capture relevant factors of variation
Disentangle underlying causes
Robust to noise
Transfer across tasks
30.2 Autoencoders
Definition 30.2 (Autoencoder). Neural network trained to reconstruct its input through a bottleneck.
Architecture:
Encoder: \(\boldsymbol{z} = f_{\text{enc}}(\boldsymbol{x})\) (compress to latent code)
Decoder: \(\hat{\boldsymbol{x}} = f_{\text{dec}}(\boldsymbol{z})\) (reconstruct)
Training: Minimize reconstruction error \[\mathcal{L}= \frac{1}{n}\sum_{i=1}^n \left\lVert\boldsymbol{x}_i - \hat{\boldsymbol{x}}_i\right\rVert^2\]
The bottleneck forces the network to learn compressed, meaningful representations.
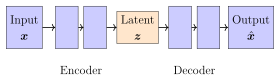
30.2.1 Variants of Autoencoders
Definition 30.3 (Autoencoder Variants). 1. Denoising Autoencoder (DAE):
Input: Corrupted version \(\tilde{\boldsymbol{x}}\) (add noise)
Target: Original clean \(\boldsymbol{x}\)
Forces learning robust features
2. Sparse Autoencoder:
Add sparsity penalty: \(\mathcal{L}= \text{reconstruction} + \lambda \sum_j |z_j|\)
Encourages few active latent units
3. Variational Autoencoder (VAE):
Learns probability distribution \(p(\boldsymbol{z}|\boldsymbol{x})\)
Encoder outputs \(\mu\) and \(\sigma\) of Gaussian
Can generate new samples by sampling from \(p(\boldsymbol{z})\)
Loss: \(\mathcal{L}= \text{reconstruction} + \text{KL}(q(\boldsymbol{z}|\boldsymbol{x}) \| p(\boldsymbol{z}))\)
4. Contractive Autoencoder:
Penalizes sensitivity of encoding to input perturbations
More robust representations
Applications of Autoencoders:
Dimensionality reduction: Alternative to PCA (non-linear)
Anomaly detection: High reconstruction error \(\to\) anomaly
Denoising: Remove noise from images, audio
Data generation: VAEs generate new samples
Feature learning: Use latent codes as features for downstream tasks
Pretraining: Initialize networks for supervised learning
30.3 Word Embeddings
30.3.1 Motivation
Definition 30.4 (Word Representation Problem). How to represent words for machine learning?
One-hot encoding: \[\text{``cat''} = [0, 0, 1, 0, \ldots, 0], \quad \text{``dog''} = [0, 0, 0, 1, \ldots, 0]\]
Problems:
High-dimensional (\(|V|\) for vocabulary size)
Sparse (only one 1)
No semantic similarity (all words equally distant)
Solution: Dense, low-dimensional embeddings that capture semantics.
30.3.2 Word2Vec
Definition 30.5 (Word2Vec). Learn word embeddings by predicting context words.
Two architectures:
1. CBOW (Continuous Bag of Words):
Input: Context words
Output: Target (center) word
Predict word from its context
2. Skip-gram:
Input: Target word
Output: Context words
Predict context from word
Training objective (Skip-gram): \[\max \frac{1}{T}\sum_{t=1}^T \sum_{-c \leq j \leq c, j \neq 0} \log P(w_{t+j} | w_t)\] where \(c\) is context window size.
Probability: \[P(w_O | w_I) = \frac{\exp(\boldsymbol{v}_{w_O}^\top \boldsymbol{v}_{w_I})}{\sum_{w \in V} \exp(\boldsymbol{v}_w^\top \boldsymbol{v}_{w_I})}\]
Word2Vec Properties:
Semantic similarity:
Similar words have similar embeddings
\(\text{similarity}(\text{``cat''}, \text{``dog''}) > \text{similarity}(\text{``cat''}, \text{``car''})\)
Analogies: \[\boldsymbol{v}_{\text{king}} - \boldsymbol{v}_{\text{man}} + \boldsymbol{v}_{\text{woman}} \approx \boldsymbol{v}_{\text{queen}}\] Vector arithmetic captures relationships!
Composition:
“New York” = embedding of “New” + embedding of “York”
Training efficiency:
Negative sampling: Instead of full softmax over \(|V|\), sample few negative examples
Hierarchical softmax: Use tree structure for faster computation
30.3.3 GloVe
Definition 30.6 (GloVe (Global Vectors)). Learn embeddings by factorizing word co-occurrence matrix.
Objective: \[J = \sum_{i,j=1}^{|V|} f(X_{ij})(\boldsymbol{w}_i^\top \tilde{\boldsymbol{w}}_j + b_i + \tilde{b}_j - \log X_{ij})^2\] where:
\(X_{ij}\): Number of times word \(j\) appears in context of word \(i\)
\(f(X_{ij})\): Weighting function (down-weight rare co-occurrences)
Advantage: Uses global corpus statistics (Word2Vec uses local context).
30.4 Contrastive Learning
Definition 30.7 (Contrastive Learning). Learn representations by contrasting similar and dissimilar examples.
Core idea: Pull similar examples together, push dissimilar ones apart in embedding space.
SimCLR (Simple Framework for Contrastive Learning):
Data augmentation: Create two views of each image (crop, color jitter, etc.)
Encode: Pass through neural network \(f(\cdot)\) to get embeddings
Project: Apply projection head \(g(\cdot)\) to get \(\boldsymbol{z}\)
Contrastive loss: \[\ell_{i,j} = -\log \frac{\exp(\text{sim}(\boldsymbol{z}_i, \boldsymbol{z}_j)/\tau)}{\sum_{k=1}^{2N} \mathbb{1}_{k \neq i} \exp(\text{sim}(\boldsymbol{z}_i, \boldsymbol{z}_k)/\tau)}\] where \(\text{sim}(\boldsymbol{u}, \boldsymbol{v}) = \boldsymbol{u}^\top\boldsymbol{v} / (\left\lVert\boldsymbol{u}\right\rVert\left\lVert\boldsymbol{v}\right\rVert)\) (cosine similarity).
Why Contrastive Learning is Powerful:
Self-supervised: No labels needed! Use data augmentation to create positive pairs.
State-of-the-art results:
SimCLR: Competitive with supervised learning on ImageNet
MoCo (Momentum Contrast): Efficient contrastive learning
CLIP: Contrastive learning for image-text pairs (foundation of DALL-E)
Applications:
Image classification (pretrain on unlabeled data)
Few-shot learning (good representations with few labels)
Transfer learning (transfer to downstream tasks)
Multi-modal learning (vision + language)
Recent methods:
BYOL (Bootstrap Your Own Latent): No negative pairs needed
SimSiam: Even simpler, still effective
SwAV: Clustering-based contrastive learning
31 Ethics and Fairness in Machine Learning
31.1 Bias and Discrimination
Definition 31.1 (Types of Bias in ML). 1. Data Bias:
Historical bias: Data reflects past discrimination
Sampling bias: Training data not representative of population
Measurement bias: Features measured differently for different groups
2. Algorithmic Bias:
Model amplifies existing biases
Optimization objective doesn’t account for fairness
3. Interaction Bias:
Feedback loops: Biased predictions reinforce themselves
Example: Predictive policing \(\to\) more arrests in certain areas \(\to\) model predicts more crime there
Example 31.2 (Real-World Bias Cases). 1. COMPAS (Recidivism Prediction):
Predicted re-arrest risk for defendants
ProPublica investigation: Biased against African Americans
Higher false positive rate for Black defendants
2. Hiring Algorithms:
Amazon scrapped ML hiring tool (2018)
Trained on historical data (mostly male applicants)
Penalized resumes with “women’s” (e.g., “women’s chess club”)
3. Facial Recognition:
Lower accuracy for women and people of color
Training data predominantly white males
Real consequences: wrongful arrests
4. Credit Scoring:
ML models for loan approval
May discriminate based on proxy variables (zip code \(\to\) race)
31.2 Fairness Definitions
Definition 31.3 (Fairness Metrics). 1. Demographic Parity (Statistical Parity): \[P(\hat{Y} = 1 | A = 0) = P(\hat{Y} = 1 | A = 1)\] Equal positive prediction rates across groups \(A\) (e.g., race, gender).
2. Equalized Odds: \[P(\hat{Y} = 1 | Y = y, A = 0) = P(\hat{Y} = 1 | Y = y, A = 1) \quad \text{for } y \in \{0, 1\}\] Equal TPR and FPR across groups.
3. Equal Opportunity: \[P(\hat{Y} = 1 | Y = 1, A = 0) = P(\hat{Y} = 1 | Y = 1, A = 1)\] Equal TPR (recall) across groups. Subset of equalized odds.
4. Predictive Parity: \[P(Y = 1 | \hat{Y} = 1, A = 0) = P(Y = 1 | \hat{Y} = 1, A = 1)\] Equal precision across groups.
5. Individual Fairness: Similar individuals should receive similar predictions (harder to formalize).
Fairness Trade-offs:
Impossibility results: Cannot satisfy all fairness definitions simultaneously (except in trivial cases).
Accuracy vs Fairness: Often a trade-off
Unconstrained model: Highest accuracy, may be unfair
Fair model: Lower accuracy, satisfies fairness constraints
Which fairness metric to use?
Depends on context and stakeholders
Medical diagnosis: Equal opportunity (equal TPR)
Advertising: Demographic parity
Criminal justice: Combination of metrics
Mitigation strategies:
Pre-processing: Transform data to remove bias
In-processing: Add fairness constraints to training
Post-processing: Adjust predictions to satisfy fairness
31.3 Explainable AI (XAI)
Definition 31.4 (Explainability). The ability to explain or present ML predictions in understandable terms to humans.
Why important?:
Trust: Users need to trust model decisions
Debugging: Understand why model fails
Regulation: GDPR “right to explanation”
Fairness: Detect and fix bias
Safety: Critical applications (healthcare, autonomous vehicles)
31.3.1 LIME (Local Interpretable Model-agnostic Explanations)
Definition 31.5 (LIME). Explain individual predictions by approximating the model locally with an interpretable model.
Algorithm:
Select instance \(\boldsymbol{x}\) to explain
Perturb \(\boldsymbol{x}\) to create neighborhood samples
Get predictions from black-box model on perturbed samples
Fit simple interpretable model (e.g., linear regression) weighted by proximity to \(\boldsymbol{x}\)
Explain prediction using interpretable model’s coefficients
Intuition: Fit a simple model locally around the prediction to understand what features matter.
Example 31.6 (LIME for Image Classification). Model predicts “husky” for an image.
LIME highlights image regions:
Green regions: Support prediction (dog’s face, fur)
Red regions: Against prediction (background)
Reveals: Model uses dog features (good) or background snow (bad—spurious correlation)?
31.3.2 SHAP (SHapley Additive exPlanations)
Definition 31.7 (SHAP). Uses Shapley values from cooperative game theory to assign each feature an importance value for a prediction.
Shapley value: Fair distribution of “payout” (prediction) among “players” (features).
Properties:
Local accuracy: Explanation matches prediction
Consistency: If feature contributes more, importance increases
Missingness: Feature not used \(\to\) zero importance
Computation: \[\phi_i = \sum_{S \subseteq F \setminus \{i\}} \frac{|S|!(|F|-|S|-1)!}{|F|!}[f(S \cup \{i\}) - f(S)]\] Average marginal contribution of feature \(i\) across all feature subsets.
Advantages over LIME:
Theoretical foundation (game theory)
Consistent across models
Can aggregate for global explanations
Using SHAP in Python:
import shap

# Train model
model = RandomForestClassifier()
model.fit(X_train, y_train)

# Create explainer
explainer = shap.TreeExplainer(model)

# Compute SHAP values
shap_values = explainer.shap_values(X_test)

# Visualize
shap.summary_plot(shap_values, X_test)  # Global
shap.force_plot(explainer.expected_value,
                shap_values[0], X_test.iloc[0])  # Local
31.3.3 Other Interpretability Methods
Attention Mechanisms: In Transformers, attention weights show which input tokens are important
Saliency Maps: Gradient-based methods for images (highlight important pixels)
Partial Dependence Plots (PDP): Show relationship between feature and prediction
Counterfactual Explanations: “What would need to change for different prediction?”
Anchors: Find sufficient conditions for prediction (“If age > 50 AND income > 100K, then approve”)
31.4 Responsible AI Practices
Diverse Teams: Include diverse perspectives in development
Data Auditing: Check training data for bias, representativeness
Fairness Testing: Evaluate model across demographic groups
Transparency: Document data sources, model architecture, limitations
Human Oversight: Keep humans in the loop for critical decisions
Regular Audits: Monitor model performance and fairness in production
Right to Appeal: Allow users to contest automated decisions
Privacy: Protect user data, use privacy-preserving techniques (differential privacy, federated learning)
Impact Assessment: Consider societal impact before deployment
Continuous Learning: Stay updated on fairness research and regulations
32 Modern Trends
32.1 Transfer Learning and Fine-Tuning
Definition 32.1 (Transfer Learning). Use knowledge learned from one task (source) to improve learning on a different but related task (target).
Why transfer?
Limited labeled data for target task
Training from scratch is expensive
Pretrained models capture general features
Typical workflow:
Pretrain: Train model on large dataset (e.g., ImageNet)
Transfer: Use pretrained weights as initialization
Fine-tune: Train on target task with small learning rate
Transfer Learning Strategies:
1. Feature Extraction (Frozen Pretrained Model):
Freeze all pretrained layers
Add new layers on top
Train only new layers
Fast, works when target data is small and similar to source
2. Fine-Tuning All Layers:
Unfreeze all layers
Train entire network with small learning rate
Best performance, needs more target data
3. Fine-Tuning Top Layers Only:
Freeze early layers (general features)
Unfreeze later layers (task-specific features)
Balance between feature extraction and full fine-tuning
Success stories:
Computer Vision: ResNet, EfficientNet pretrained on ImageNet
NLP: BERT, GPT pretrained on massive text corpora
Speech: Wav2Vec2 pretrained on unlabeled audio
32.2 Foundation Models
Definition 32.2 (Foundation Models). Large-scale models trained on broad data that can be adapted to a wide range of downstream tasks.
Characteristics:
Trained on massive diverse datasets (web-scale)
Billions of parameters
Emergent capabilities (not explicitly trained for)
General-purpose (adapt to many tasks)
Paradigm shift: \[\text{Traditional: Task-specific data} \to \text{Task-specific model}\] \[\text{Foundation: General data} \to \text{Foundation model} \to \text{Many tasks}\]
32.2.1 BERT (Bidirectional Encoder Representations from Transformers)
Definition 32.3 (BERT). Pretrained Transformer encoder (2018, Google).
Pretraining tasks:
Masked Language Modeling (MLM): Mask 15% of tokens, predict them \[\text{Input: } \text{The [MASK] is on the table}\] \[\text{Predict: } \text{cat}\]
Next Sentence Prediction (NSP): Predict if sentence B follows sentence A
Impact:
State-of-the-art on many NLP tasks
Spawned many variants (RoBERTa, ALBERT, DistilBERT)
Showed power of bidirectional context
32.2.2 GPT (Generative Pre-trained Transformer)
Definition 32.4 (GPT Family). Autoregressive Transformer decoders (OpenAI).
GPT-1 (2018): 117M parameters GPT-2 (2019): 1.5B parameters GPT-3 (2020): 175B parameters GPT-4 (2023): Estimated \(>\)1T parameters (multimodal)
Training: Predict next token given previous tokens \[P(w_t | w_1, \ldots, w_{t-1})\]
Key insight: Scale \(+\) next token prediction \(=\) emergent abilities
Few-shot learning: Learn from few examples in prompt
In-context learning: Adapt to task from prompt alone
Chain-of-thought reasoning: Generate step-by-step solutions
GPT-3 Capabilities:
Zero-shot: No examples, just task description
Translate to French: Hello, how are you?
Output: Bonjour, comment allez-vous?Few-shot: Provide examples in prompt
Q: What is 2+2? A: 4
Q: What is 5+3? A: 8
Q: What is 7+9? A: 16
Emergent abilities (not seen in smaller models):
Arithmetic
Code generation
Common sense reasoning
Instruction following
Limitations:
Hallucinations (generates plausible but false information)
Bias from training data
No grounding in real world
Expensive to run
32.3 Federated Learning
Definition 32.5 (Federated Learning). Train models across decentralized devices without sharing raw data.
Workflow:
Server sends global model to clients
Each client trains on local data
Clients send model updates (not data) to server
Server aggregates updates into global model
Repeat
Aggregation (FedAvg): \[\boldsymbol{w}_{t+1} = \sum_{k=1}^K \frac{n_k}{n} \boldsymbol{w}_k^{(t)}\] Weighted average of client models by data size.
Benefits of Federated Learning:
Privacy: Data never leaves device
Reduced latency: On-device inference
Regulatory compliance: GDPR, HIPAA
Bandwidth efficiency: Share models, not data
Challenges:
Non-IID data: Each client has different distribution
Communication cost: Many rounds needed
Heterogeneous devices: Different compute power
Privacy attacks: Model updates can leak information
Applications:
Mobile keyboards (Gboard)
Healthcare (multiple hospitals, can’t share patient data)
Finance (banks collaborate without sharing data)
IoT devices
Enhanced privacy:
Differential privacy: Add noise to updates
Secure aggregation: Encrypted updates
Homomorphic encryption: Compute on encrypted data
32.4 AutoML (Automated Machine Learning)
Definition 32.6 (AutoML). Automate the end-to-end process of applying ML to real-world problems.
Components:
Data preprocessing
Feature engineering
Model selection
Hyperparameter optimization
Architecture search (for neural networks)
Ensemble construction
32.4.1 Neural Architecture Search (NAS)
Definition 32.7 (NAS). Automatically design neural network architectures.
Search space: Define possible architectures (layers, connections, operations)
Search strategy:
Random search
Reinforcement learning
Evolutionary algorithms
Gradient-based (DARTS)
Performance estimation:
Train from scratch (expensive)
Early stopping
Weight sharing (ENAS)
Performance prediction
Success: NAS-discovered architectures (EfficientNet, AmoebaNet) outperform hand-designed ones.
32.4.2 AutoML Tools
Auto-sklearn: Automated scikit-learn pipeline
TPOT: Genetic programming for pipeline optimization
H2O AutoML: Automated model selection and ensembling
Google Cloud AutoML: Managed AutoML service
AutoKeras: NAS for Keras
PyCaret: Low-code ML library
AutoML: Democratization or Threat?
Pros:
Lowers barrier to entry (non-experts can use ML)
Frees experts to focus on problem formulation
Often finds better models than manual search
Reproducible workflows
Cons:
Can be slow (lots of trials)
Black box (hard to understand choices)
May not consider domain constraints
Expensive (compute cost)
Reality: AutoML is a tool, not a replacement. ML expertise still needed for:
Problem formulation
Data quality assessment
Interpreting results
Debugging failures
Ethical considerations
32.5 Future Directions
Emerging Trends and Open Problems:
1. Multimodal Learning:
Models that understand multiple modalities (text, image, audio, video)
CLIP, DALL-E, Flamingo, GPT-4
2. Continual Learning:
Learn new tasks without forgetting old ones
Overcome catastrophic forgetting
3. Few-Shot and Zero-Shot Learning:
Learn from very few examples
Generalize to unseen classes
4. Causal Machine Learning:
Go beyond correlation to causation
Robust to distribution shift
Counterfactual reasoning
5. Energy-Efficient ML:
Reduce environmental impact (training GPT-3: tons of CO2)
Model compression, pruning, quantization
Efficient architectures
6. Trustworthy AI:
Robustness to adversarial attacks
Uncertainty quantification
Certified defenses
7. Human-AI Collaboration:
AI as assistant, not replacement
Interactive ML
Human-in-the-loop systems
8. Quantum Machine Learning:
Leverage quantum computers for ML
Quantum neural networks
Early stage, potential for exponential speedups
32.6 Conclusion
Machine Learning is a rapidly evolving field with profound impact on society. As practitioners, we must:
Master fundamentals: Strong foundation enables understanding new methods
Stay curious: New papers, techniques, applications emerge daily
Think critically: Not every problem needs ML; not every solution is ethical
Embrace uncertainty: Models are tools, not truth
Prioritize ethics: Consider impact on individuals and society
Collaborate: ML is interdisciplinary—work with domain experts
Keep learning: The field evolves faster than any textbook
The journey from mathematical foundations to modern foundation models is remarkable. Yet the most exciting developments are still ahead. Whether through scientific breakthroughs, ethical frameworks, or novel applications, the future of ML will be shaped by thoughtful practitioners who combine technical skill with wisdom.
Your role: Build systems that are not just intelligent, but beneficial.
Exercise 32.8.
Design a Q-learning agent for a simple grid world. Define states, actions, rewards, and write the Q-update rule.
Explain why experience replay and target networks are crucial for DQN stability. What problems do they solve?
Compare PCA (from Part 5) and autoencoders for dimensionality reduction. When would you prefer autoencoders?
Given Word2Vec embeddings, explain why \(\boldsymbol{v}_{\text{king}} - \boldsymbol{v}_{\text{man}} + \boldsymbol{v}_{\text{woman}} \approx \boldsymbol{v}_{\text{queen}}\) works. What does this reveal about the embedding space?
A facial recognition system has 99% accuracy but 5% false positive rate for one demographic group vs 1% for another. Which fairness definition is violated? Propose a mitigation strategy.
You have 100 labeled examples and 10,000 unlabeled examples for image classification. Design a strategy using transfer learning and/or contrastive learning.
Compare fine-tuning BERT for sentiment analysis vs training a CNN from scratch. What are the trade-offs?
Design a federated learning system for predicting disease from hospital data. Address: communication efficiency, privacy, and non-IID data distributions.
End of Machine Learning Notes
“The best way to predict the future is to invent it.” — Alan Kay